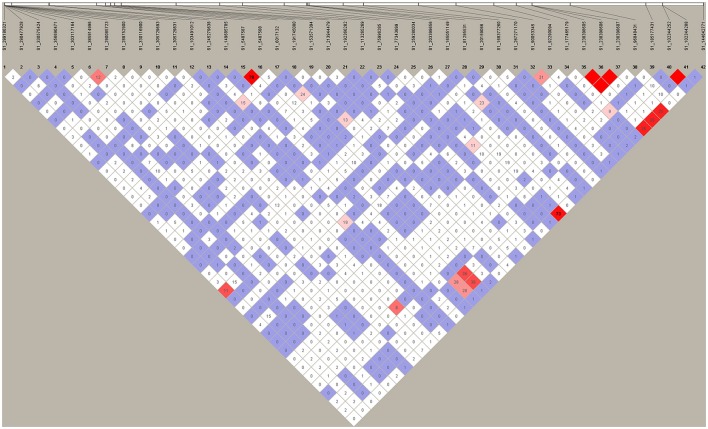
Figure 4.
Linkage Disequilibrium (LD) amongst significant markers. HAPLOVIEW v.4.2 (http://www.broadinstitute.org/haploview/haploview) pairwise LD values (r2*100) for 42 SNPs based on genotypes of 198 individuals were used to test whether any of the SNPs significantly associated with salt tolerance were in strong LD with one another. Bright red coloring indicates D' = 1, LOD ≥ 2; Blue coloring indicates D' = 1, LOD < 2; White coloring indicates D' < 1, LOD < 2; Shades of pink/red coloring indicates D' < 1, LOD ≥ 2.

