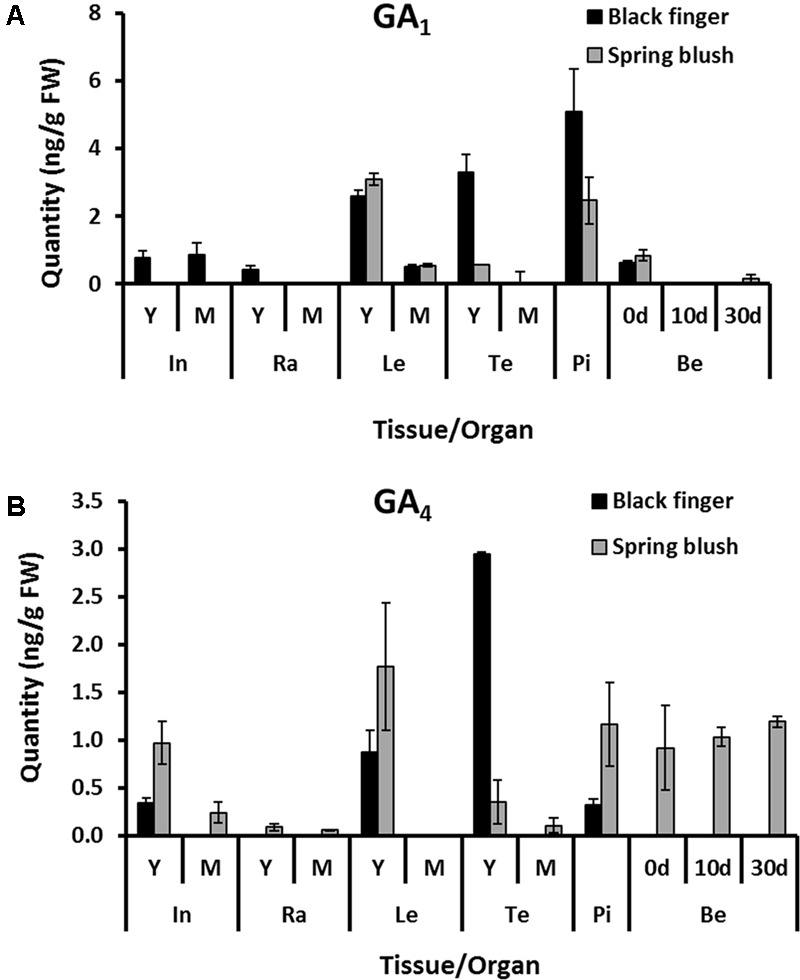
FIGURE 7.

Spatio-temporal accumulation of endogenous bioactive GAs in V. vinifera cv. Black finger (BF) and cv. Spring blush (SB). Quantification of endogenous GA1 (A) and GA4 (B) in organs of BF (black-filled bars) and SB (gray-filled bars) at different developmental stages. Bioactive GAs were extracted from 0.5 g fresh weigh of homogenized tissue, and quantified using triple quadrupole mass spectrometer coupled to an Ultra High Performance Liquid Chromatography (UHPLC) system equipped with an octylphenyl column. The bars represent the mean ± SD. of three biological replicates of extractions. In, internodes; Ra, rachis; Le, leaves; Te, tendrils; Pi, pistils; Be, berries; 0 d, berries sampled at 2–3 mm diameter (E-L 27); 10 d, Berries sampled 10 days after E-L 27; 30 d, berries sampled 30 days after E-L 27; Y, young; M, mature. Samples were collected during the 2010 growing season.
