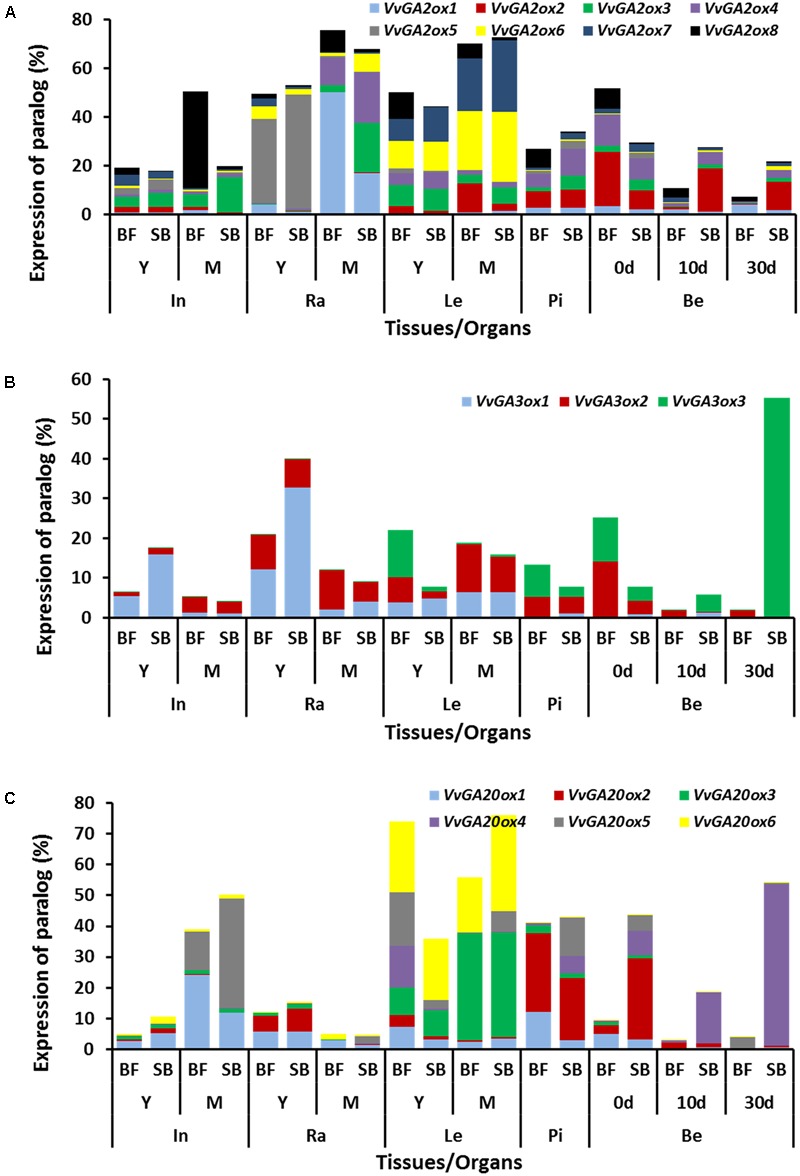
FIGURE 8.

Spatio-temporal expression profiles of GA metabolism genes in V. vinifera cv. Black finger (BF) and cv. Spring blush (SB). Spatial and temporal expression profiles of VvGA2ox (A), VvGA3ox (B), and VvGA20ox (C) paralogs in organs of BF and SB collected during the 2010 growing season. Y-axis is the normalized relative expression (NRE) (Giacomelli et al., 2013) of the respective paralog, expressed as a per cent of the total NRE of that paralog in all organs analyzed. NREs were calculated, as described by Giacomelli et al. (2013), from the average of three biological replicates of relative transcripts normalized against the expression of VvGAPDH, which is unaffected by GA. Transcripts were measured by qRT-PCR using EvaGreen DNA-binding dye on the 96.96 Dynamic Array Integrated Fluidic Circuits (IFCs). In, internodes; Ra, rachis; Le, leaves; Te, tendrils; Pi, pistils; Be, berries; 0 d, berries sampled at 2–3 mm diameter (E-L 27); 10 d, berries sampled 10 days after E-L 27; 30 d, berries sampled 30 days after E-L 27; Y, young; M, mature. Full description of experimental procedure is given in Section “Materials and Methods.” Graphs of the spatial and temporal expression profiles of the individual metabolism genes are presented in Supplementary Figure S5, and detailed statistical significance provided in Supplementary File S2.
