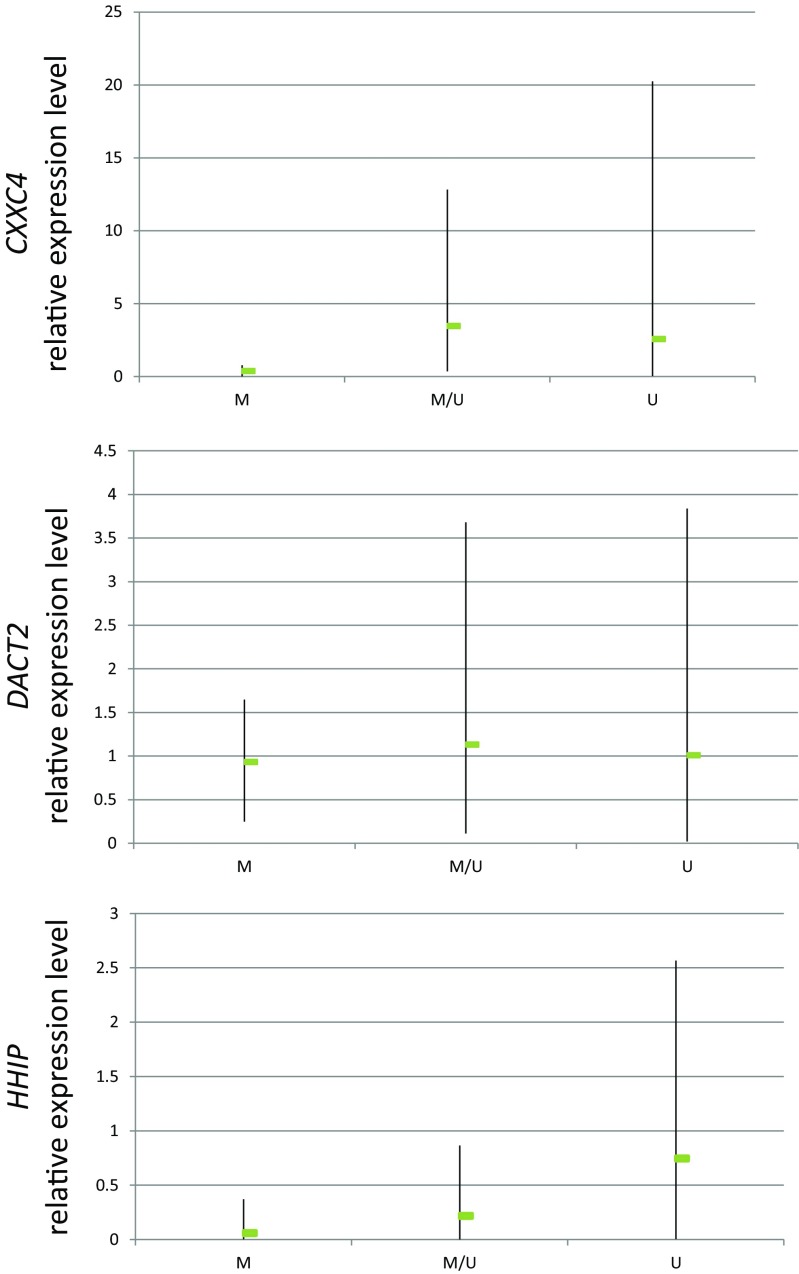
Fig. 2.
Relative expression levels of CXXC4, DACT2, and HHIP in HNSCC cell lines. The relative level of transcript was calculated as fold difference in relation to the expression in normal human keratinocytes (where expression was adopted as equal 1). The range of relative gene expression among cell lines (minimum and maximum values) and the mean level of relative expression (indicated in the graphs by the arms and the green box, respectively) in cell lines characterized by complete gene methylation (M), partial methylation (M/U), or lack of methylation (U) is shown

