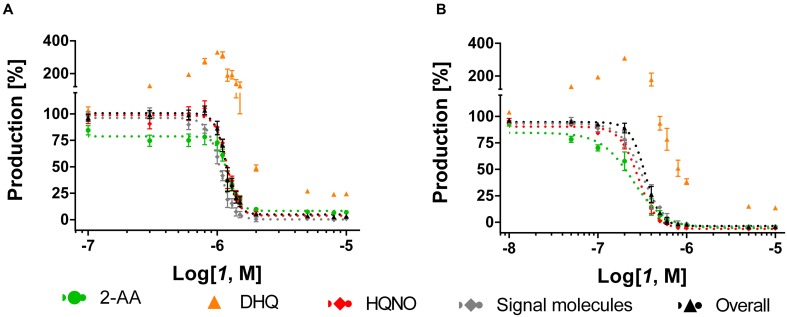
FIGURE 3.
Dose-response curves of MvfR antagonist 1 acting on MvfR-related small molecules production in PA14 wt (A) and PA14 pqsH mutant (B). 2-AA: green. DHQ: orange. Signal molecules: gray. HQNO: red. Sum of all anthranilic acid derivatives: black. The “x” axes indicate the logarithm of the concentration of the antagonists in molar units (M). The error bars indicate Standard Error of the Mean.

