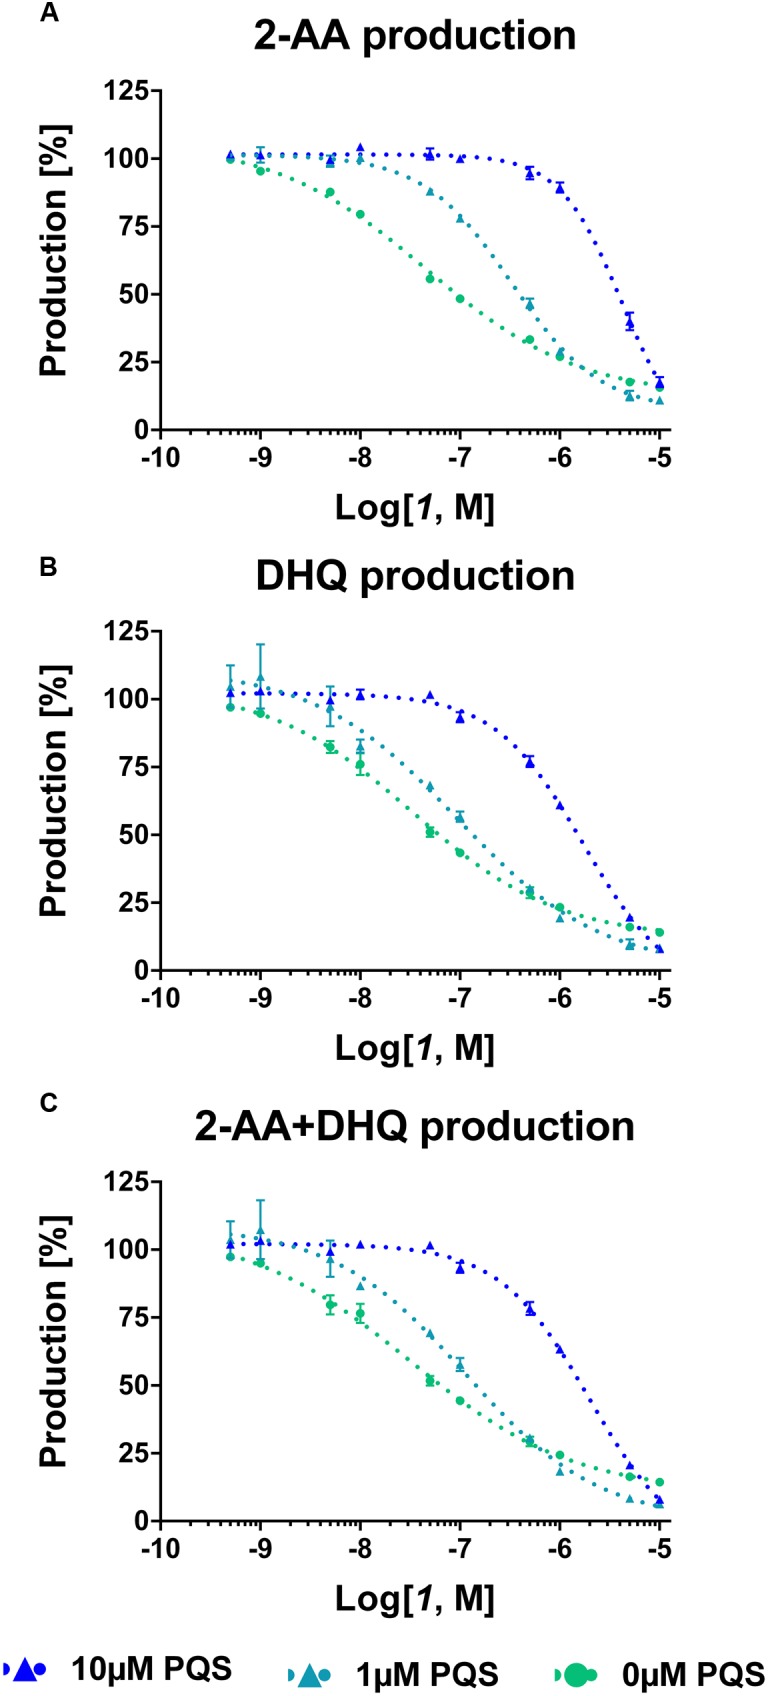
FIGURE 4.

Dose-response curves of MvfR antagonist 1 on 2-AA (A), DHQ (B) and overall (C) production in PA14 pqsC mutant with and without external addition of PQS. The “x” axes indicate the logarithm of the concentration of the antagonists in molar units (M). The error bars indicate Standard Error of the Mean.
