
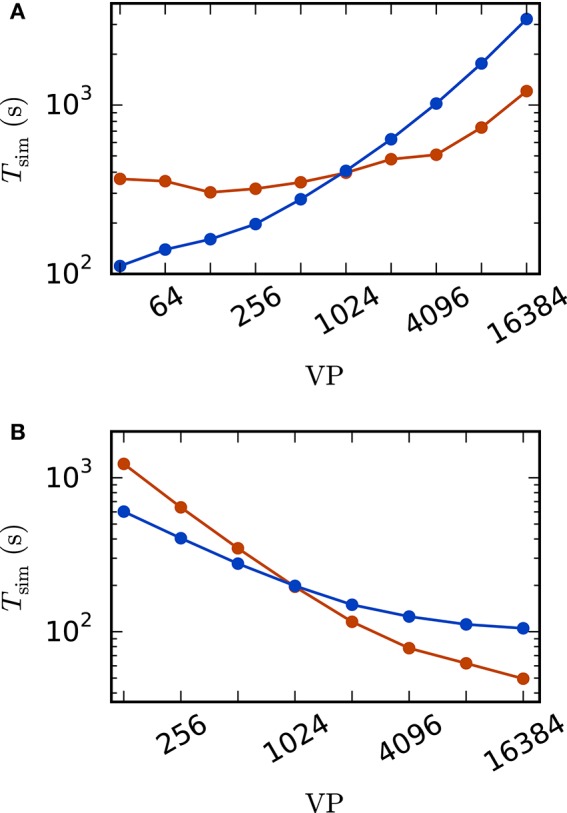
Figure 5.
Scaling behavior of an excitatory-inhibitory network. Simulation time with waveform relaxation (red curves, wfr_comm_interval: 1.0 ms, wfr_tol: 10−4) and without waveform relaxation (blue curves) as a function of the number of virtual processes in double logarithmic representation. The simulations span T = 100 ms of biological time at a computation step size of h = 0.1 ms. Sparse balanced e/i test case but with a fixed number of 2,000 inputs per unit. Other parameters: μ = 0, σ = 1 and τ = 10 ms (A) Weak scaling with 100 units per virtual process VP. (B) Strong scaling with a total number of N = 51, 200 units.