
Figure 6.
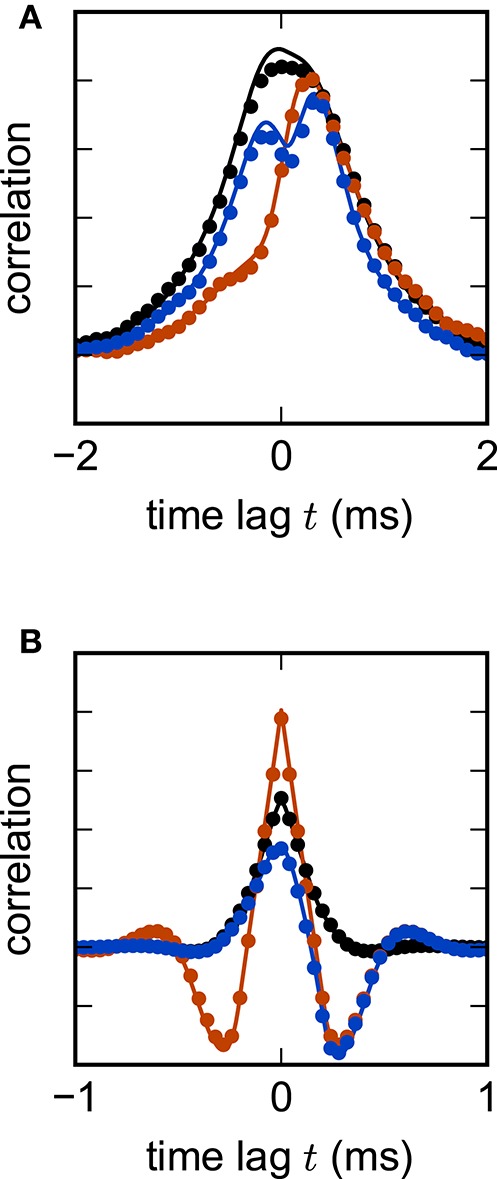
Linear rate model of a random excitatory-inhibitory network. (A) Cross-correlation functions of two pairs of excitatory units (black, red) and an excitatory-inhibitory unit pair (blue) in a network without delay. The variability across correlation functions arises from heterogeneity in network connections (difference between black and red curves) and from different combinations of cell types (e.g., difference between black and blue curves). (B) Population-averaged autocorrelation function for excitatory (black) and inhibitory units (red), and cross-correlation function between excitatory and inhibitory units (blue) in a network with delay d = 2 ms. Symbols denote simulation results, curves show theoretical predictions. Parameters: NE = 80 excitatory and NI = 20 inhibitory units, random connections with fixed out-degree, connection probability p = 0.1, excitatory weight , inhibitory weight wI = −6wE, τ = 1 ms, μ = 0, σ = 1. Step size h = 0.1 ms.