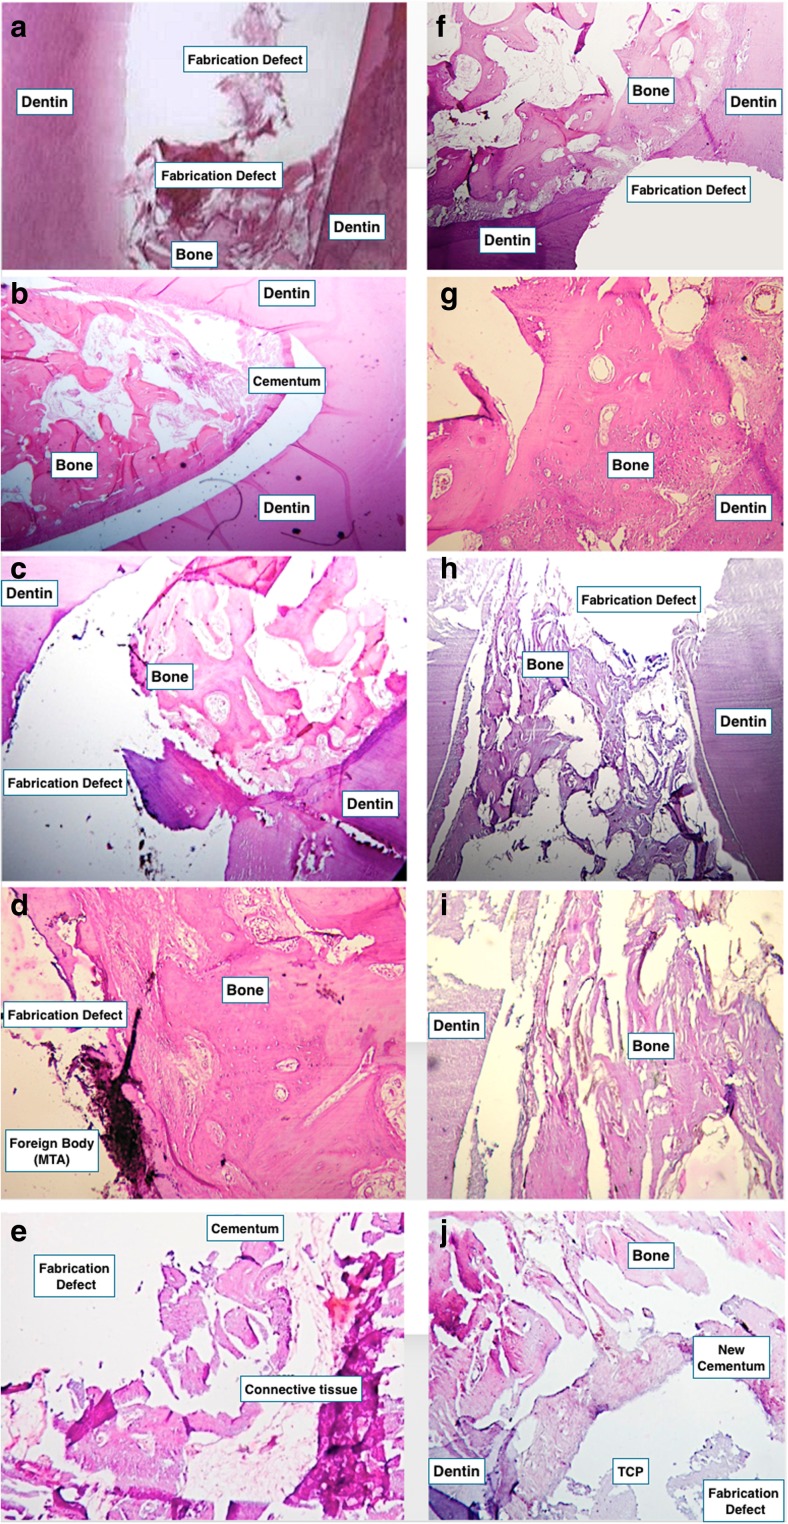
Fig. 3.
a Negative control group; b positive control group; c MTA group (×40); d MTA group (×100); e TDM group (×40); f, g TDM+DPSC group that shows new cementum and compact new bone formation on perforation site (×40, ×100); h, i TDM+DPSCs group from a different slide (×40, ×100); j TCP+DPSCs, H&E stain (×40) (note: the gap between the samples and dentin seen in these images is a processing artifact)

