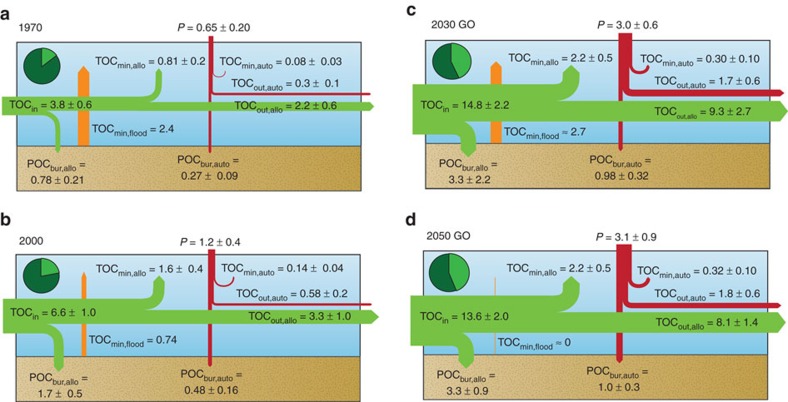
Figure 1. Global reservoir carbon budgets.
Globally integrated OC budgets of reservoirs in (a) 1970, (b) 2000, (c) 2030 and (d) 2050 (Global Orchestration, GO scenario). All fluxes are given in units of Tmol per year and rounded to two significant digits. Fluxes shown are the aggregated values for reservoirs worldwide. TOCin: global influx of POC plus DOC to dam reservoirs (note: the routing procedure avoids double counting OC passing through cascades of dams, Supplementary Fig. 2). P: primary production. TOCout: global efflux of POC plus DOC exiting dam reservoirs, without double counting TOC that passes through multiple dams. Subscripts: bur: burial; min: mineralization; flood: flooded terrestrial biomass and soil organic carbon; allo: allochthonous; auto: autochthonous; out: outflow. Errors assigned to TOCin reflect the uncertainties associated with the Global-NEWS model yield estimates. Other error estimates include those associated with the model parameterization, upscaling and errors in Global-NEWS (Methods section). Pie charts in top left of each panel represent the proportion of POC plus DOC loaded to global rivers that passes through at least one dam (shown in light green) before reaching the coastal zone.

