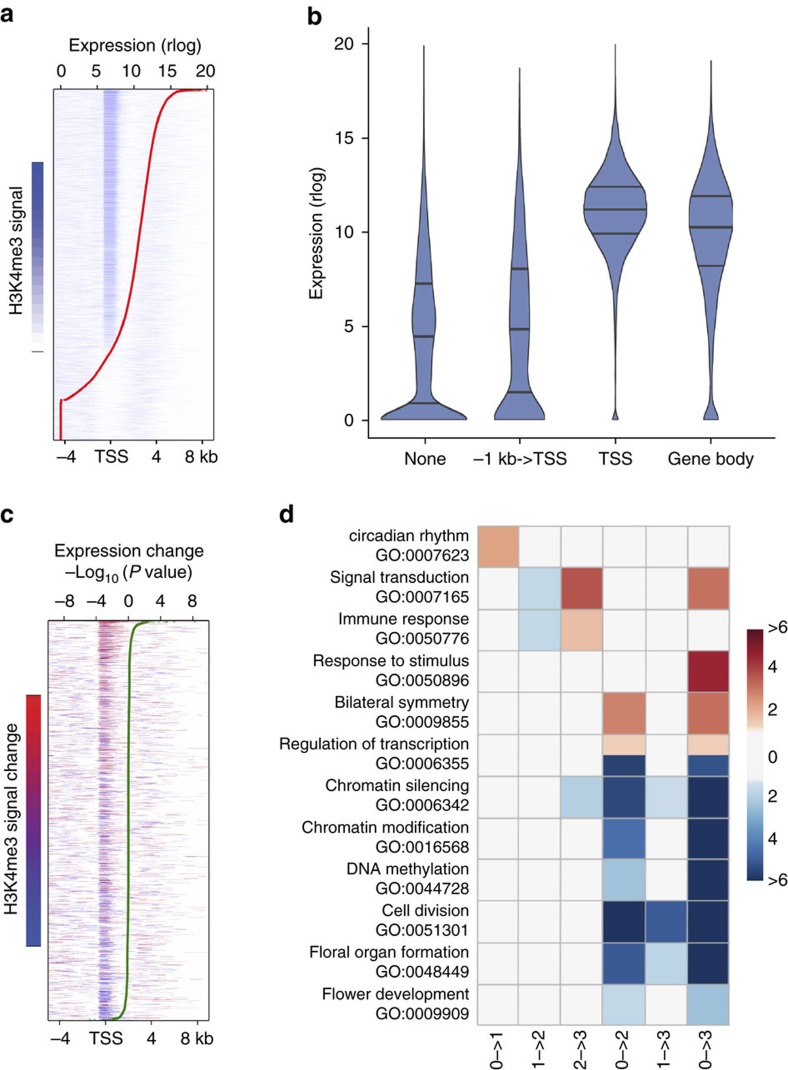
Figure 3. Positive correlation between H3K4me3 and expression.
(a) Normalized H3K4me3 signal on protein-coding genes in 0 LD samples between −4 kb and +8 kb around the TSS. Genes ordered according to their expression level (regularized logarithm (rlog) of counts, red line). (b) Distribution of expression of protein-coding genes in 0 LD samples in relation to the position of the H3K4me3 marks. (c) Protein-coding genes with significant differences in H3K4me3 signal between 0 LD and 3 LD samples. Red and blue indicate the direction and significance of gain and loss of H3K4me3, respectively. Genes ordered according to significance (−Log10(P value)) of changes in expression (green line). (d) Key biological processes enriched in genes with significant H3K4me3 changes. Colour key indicates the significance (−Log10(P value)) of the enriched GO terms that gained (red) and lost (blue) H3K4me3, respectively. Only significantly enriched GO terms (P<0.05; fold-change>2) are shown.

