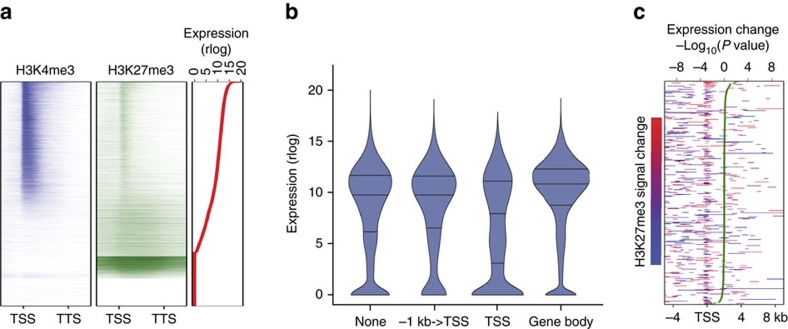
Figure 5. Profiles of H3K4me3 and H3K27me3 marks at the SAM.
(a) Distribution of normalized H3K4me3 and H3K27me3 signal across the body (±1 kb) of protein-coding genes in 0 LD sample. Regions upstream of the TSS (−1 kb) and downstream of TTS (+1 kb) were each divided into 10 bins of length 100 bp. Gene bodies were normalized to account for differences in gene length and divided into 50 bins of equal width. Genes sorted based on levels of expression (red line), and genes with no detectable expression were sorted by H3K27me3 levels. (b) Distribution of expression of protein-coding genes in 0 LD samples in relation to the position of the H3K4me27 marks. (c) Protein-coding genes with significant differences in H3K27me3 signal between 0 and 3 LDs samples. Red and blue indicate the direction and significance of gain and loss of H3K27me3, respectively. Genes ordered according to significance (−Log10(P value)) of changes in expression (green line).

