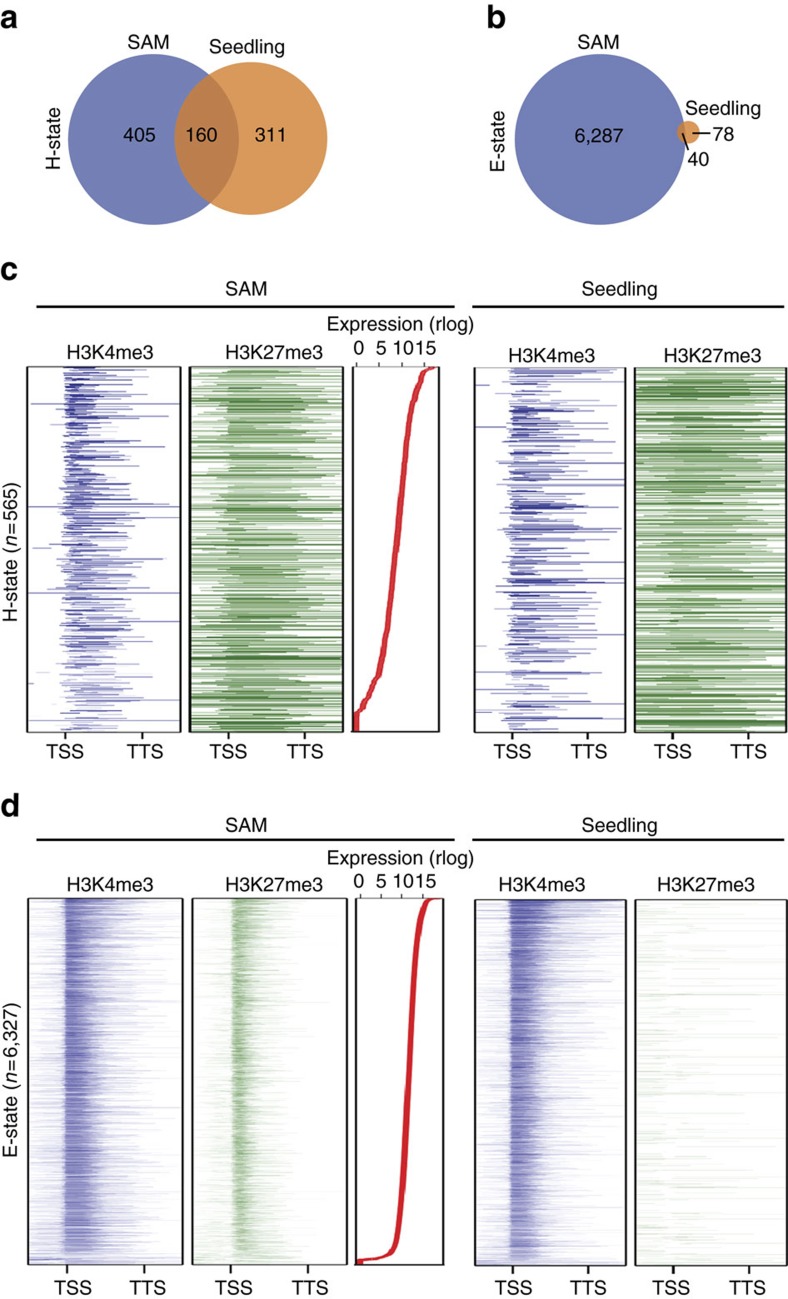
Figure 6. Enrichment of H- and E- states at the SAM.
(a,b) Overlap of genes in H-state (a) and E-state (b) detected in 0 LD SAM and in whole-seedling samples. (c,d) Distribution of H3K4me3 and H3K27me3 marks across the gene body (±1 kb) of genes in H-state (c) and E-state (d) in 0 LD SAM (left) and the whole seedlings (right). Genes were ordered by expression in the meristem samples (red lines).

