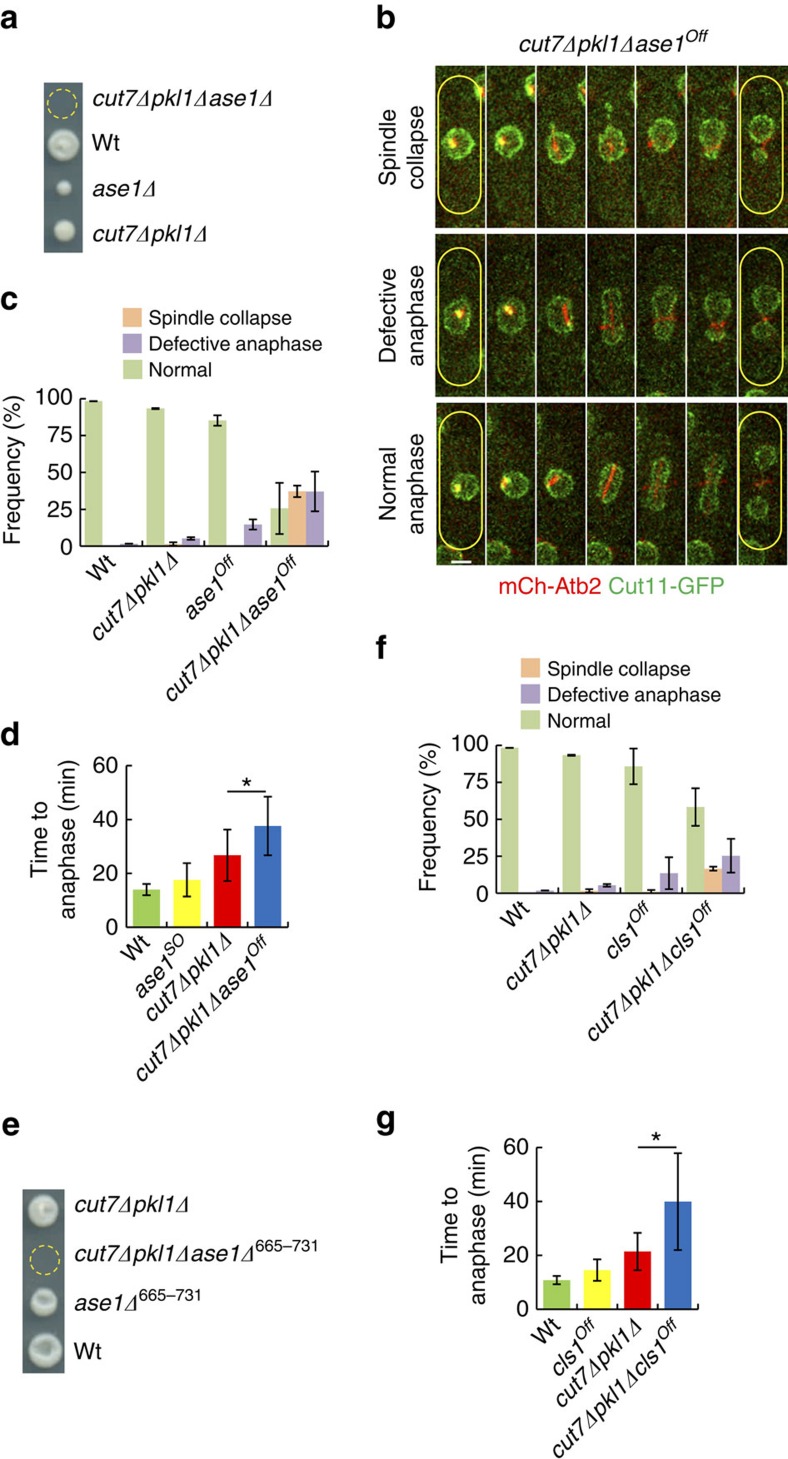
Figure 3. Ase1 and Cls1 are critical for spindle assembly in cut7Δpkl1Δ cells.
(a) Tetrad dissection of cut7Δpkl1Δ cells crossed to ase1Δ cells. (b) Time-lapse images of cut7Δpkl1Δase1Off mitotic cells expressing mCherry-Atb2 and Cut11-GFP (NE marker), after 20 h of repression/shut-off. Each frame corresponds to 5 min interval. Each row of images represents the detected phenotypes. (c) Bar plot of frequencies of spindle phenotypes in wild-type (n=240), cut7Δpkl1Δ (n=197), ase1Off (n=123) and cut7Δpkl1Δase1Off cells (n=88) after 20 h of repression/shut-off. (d) Bar plot showing the anaphase transition time of wild-type (green; n=17), ase1Off (yellow; n=23), cut7Δpkl1Δ (red; n=25), cut7Δpkl1Δase1Off cells (blue; n=21) after 20 h of repression/shut-off. *P<0.001. (e) Tetrad dissection of cut7Δpkl1Δ cells crossed to ase1Δ665-731 cells. (f) Bar plot of frequencies of spindle phenotypes in wild-type (n=240), cut7Δpkl1Δ (n=197), cls1Off (n=109) and cut7Δpkl1Δcls1Offcells (n=121) after 20 h of repression/shut-off. (g) Bar plot showing anaphase transition time of wild-type (green; n=42), cls1Off (yellow; n=33), cut7Δpkl1Δ (red; n=29) and cut7Δpkl1Δcls1Off cells (blue; n=28) after 20 h of repression/shut-off. *P<0.001. Data show mean±s.d. and Student's t-test P value. Scale bars, 2 μm.

