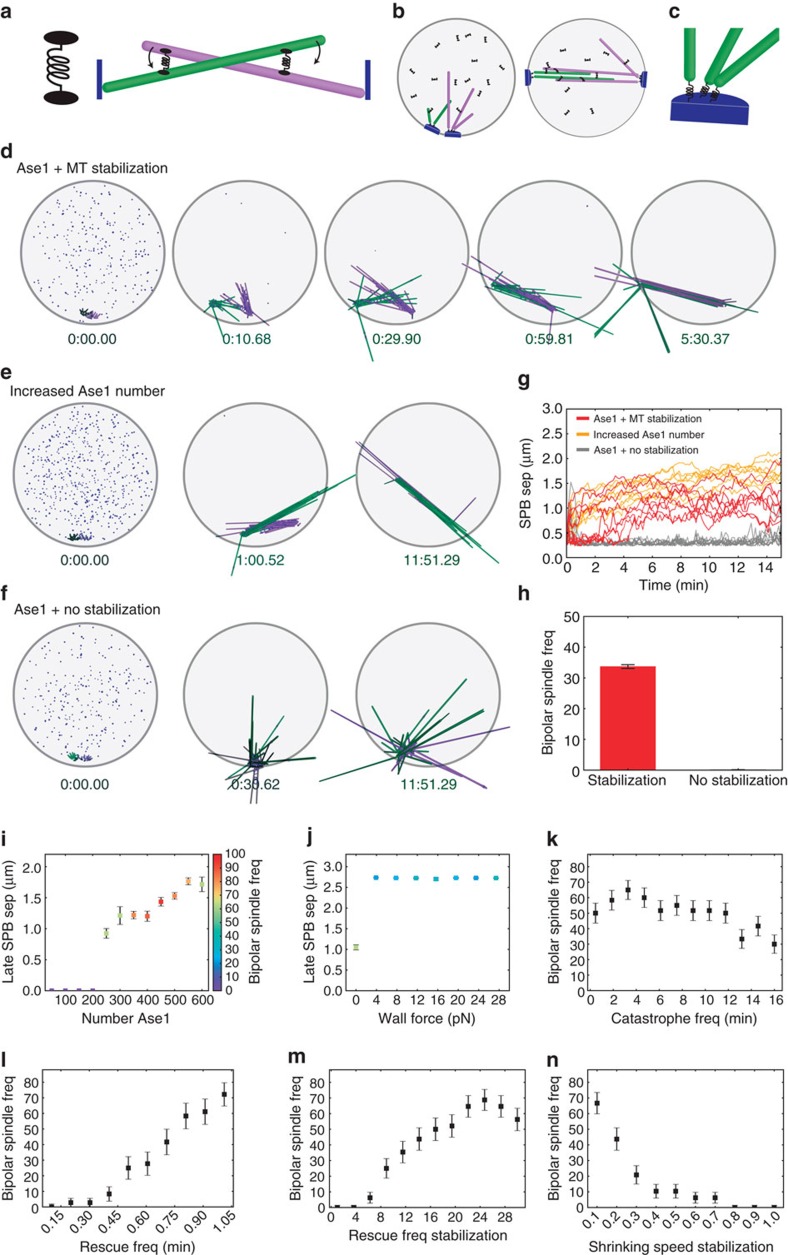
Figure 5. Computer modelling reveals Ase1 essential role in spindle formation.
(a) Schematic of Ase1 effects. Ase1 (black) crosslinks antiparallel MTs (green, purple) and promotes MT alignment and bundling. (b) Model schematic. The NE (grey sphere) contains mobile but membrane-bound SPBs (blue). MTs (green, purple) are tethered to SPBs. Ase1 molecules (black) diffuse within the volume enclosed by the NE and can attach to and move along MTs. (c) Schematic of SPBs and MT minus ends. MTs are tethered via springs to SPBs. (d) Image sequences of spindle assembly simulation. Initially the SPBs are adjacent, and each MT is 0.1 μm long (t=0). Black spheres/lines indicate unbound/bound Ase1 molecules, which initially diffuse in the nucleoplasm. Times shown are in minutes and seconds. A bipolar spindle forms, elongates and remains stable through the end of the 10-min simulation. (e) Image sequences of spindle assembly with increased Ase1 number. (f) Image sequences of spindle assembly simulation that mimics Cls1 deletion. Ase1 molecules are present and can crosslink antiparallel MTs, but Ase1 does not cause stabilization of MT dynamics. Spindle assembly does not occur. (g) Quantification of multiple simulations using the parameters of d–f, showing SPB separation as a function of time. (h) Frequency of bipolar spindle assembly for randomly sampled parameter sets with and without stabilization of MT dynamics by crosslinking. (i–n) Dependence of spindle assembly and length on single varied parameters. (i) Number of Ase1 molecules, (j) wall force, (k) catastrophe frequency, (l) rescue frequency, (m) rescue frequency stabilization, (n) shrinking speed stabilization. Note that in i and j the number of simulations corresponding to each point is indicated by the colour of the point, as shown in the colour bar. Data show mean±s.d.

