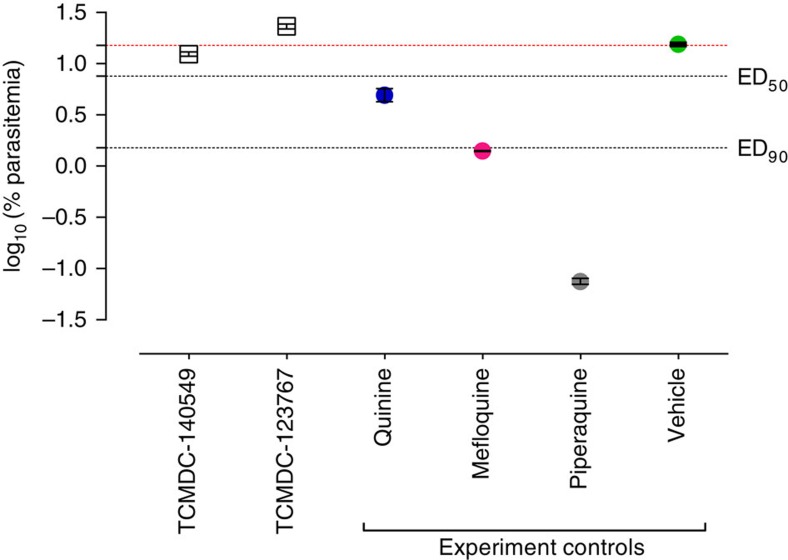
Figure 7. Effect of two TCAMS hits in the P. berghei in vivo mouse model.
Each experiment included a control group treated with vehicle (green circle) used as a reference to calculate the percentage of inhibition of parasitaemia in peripheral blood (dotted red line). The response of standard antimalarials in the same assay is also presented (blue, magenta and grey circles). Represented data are the mean±s.e.m. log10 [% asexual blood stages at day 4] of two mice per point.

