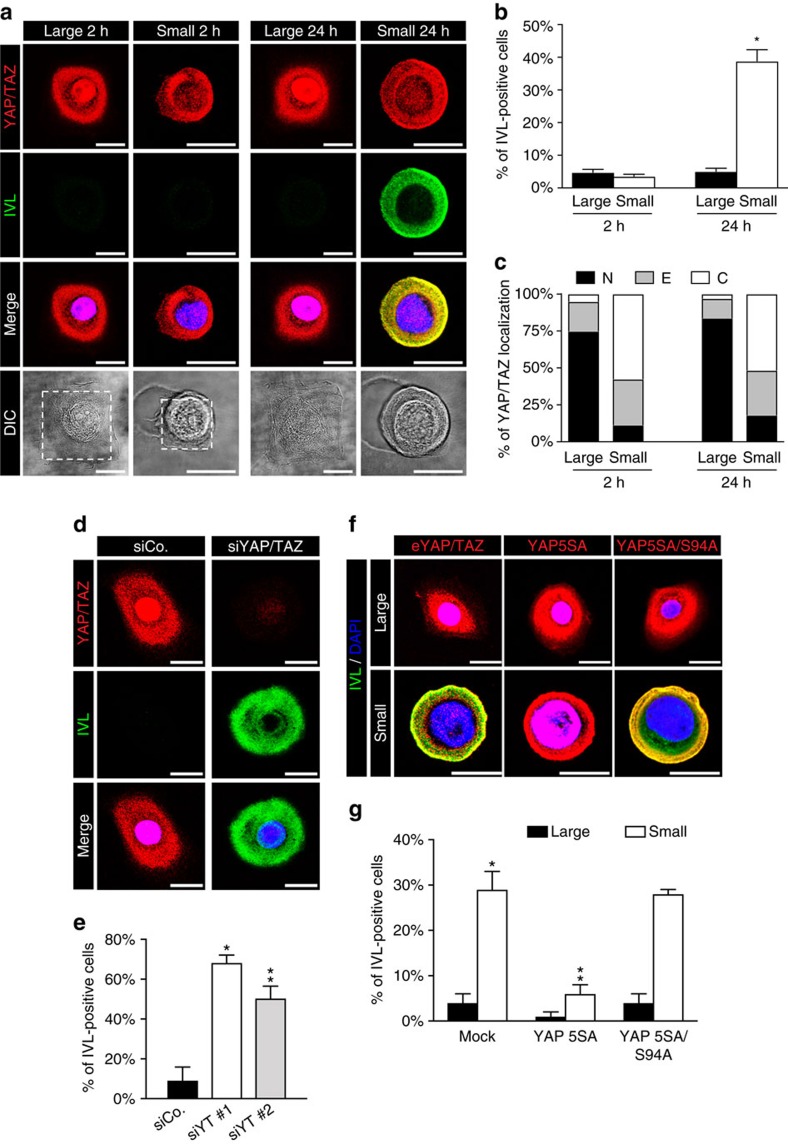
Figure 1. Controlling cell shape regulates the fate of individual epidermal SCs through YAP/TAZ.
(a) Confocal IF (top) and bright field images (bottom) of neonatal human epidermal keratinocytes (nHEK) plated as individual cells on square microprinted fibronectin islands of 1,024 μm2 (large) or 300 μm2 (small). Cells were stained for endogenous YAP and TAZ proteins (red) and Involucrin (IVL, green). DAPI (blue) is a nuclear counterstain. Scale bar: 20 μm. Dotted lines highlight microprinted fibronectin islands. (b) Quantitation of differentiation of experiments shown in a. Bars represent mean+s.e.m. (*P<0.0001, compared to cells on large at 24 h; Student's t-test). (c) Proportion of nHEK cells displaying preferential nuclear YAP/TAZ localization (N, black), even distribution of YAP/TAZ in nucleus and cytoplasm (E, grey) or cytoplasmic YAP/TAZ (C, white). (b,c) Data from at least three independent experiments. (d) nHEK cells were transfected with control siRNA (siCo.) or with two independent sets of siRNAs against YAP and TAZ mRNAs (siYT #1, siYT #2, see Supplementary Data 2). Staining as in a. Scale bar: 20 μm. (e) Quantitation of differentiation of nHEK cells treated as in d. Bars represent mean+s.d. (n=3 independent experiments. *P<0.0001, **P<0.001, compared to siCo.; Student's t-test). See also Supplementary Fig. 2a for western blot analysis of nHEK differentiation and Supplementary Fig. 2b for the effect of YAP/TAZ knockdown on keratinocyte proliferation. (f) nHEK cells were infected either with an empty vector (Mock) or with the indicated doxycycline-inducible lentiviral YAP constructs. After 24 h, cells were replated on either small or large fibronectin islands, induced with doxycycline for additional 24 h and finally analysed. Confocal images show representative staining for either endogenous YAP/TAZ proteins in Mock-infected cells or the HA-tagged YAP constructs (red), merged with Involucrin (green) and DAPI (blue). Scale bar: 20 μm. See Supplementary Fig. 1d for HA-tag background staining on Mock-infected control cells. (g) Quantitation of differentiation of experiments shown in f. Bars represent mean+s.d. (n=3 independent experiments. *P<0.0001 compared to Mock-infected cells plated on large, **P<0.001 compared to Mock-infected cells plated on small; Student's t-test).

