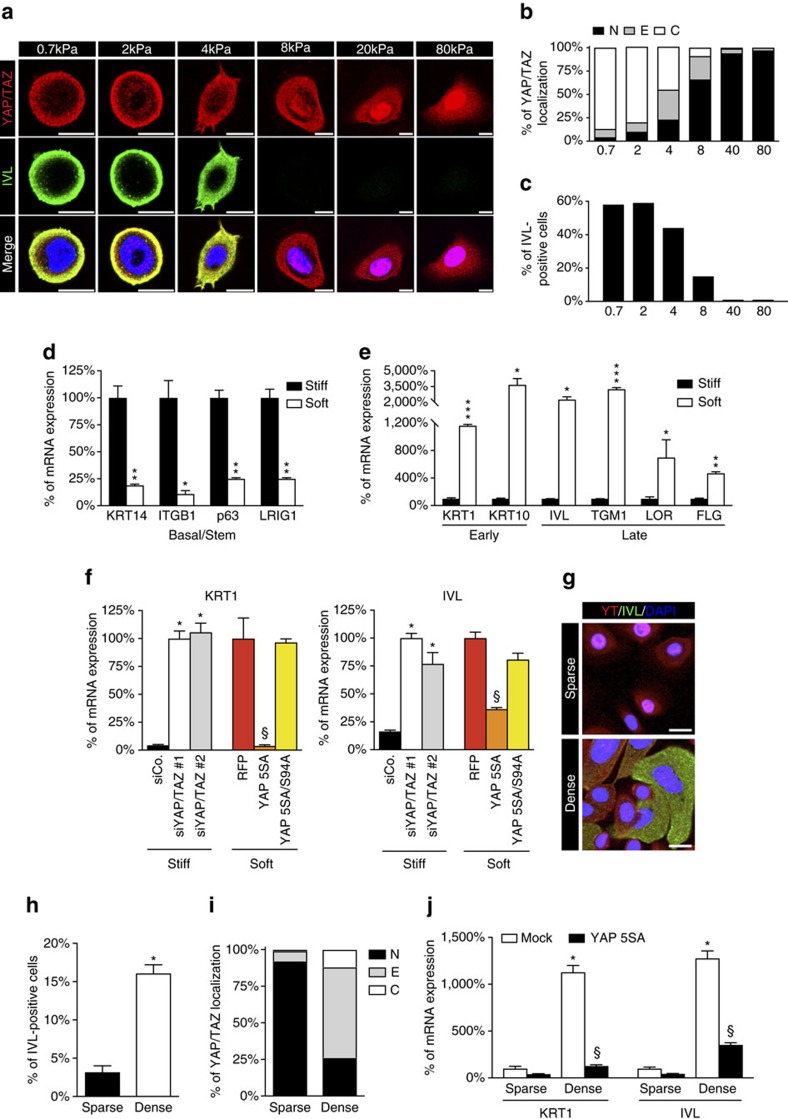
Figure 2. Soft ECM or high density lead to epidermal SC differentiation through YAP/TAZ inhibition.
(a) Confocal IF images of YAP/TAZ (red) and Involucrin (green) proteins in nHEK cells plated for 24 h on a series of fibronectin-coated polyacrylamide hydrogels ranging from 0.7 to 80 kPa elastic modulus. DAPI (blue) is a nuclear counterstain. Scale bar: 20 μm. (b,c) The analysis of YAP/TAZ subcellular distribution (b) and the quantitation of differentiation (c) induced by ECM substrates with different elasticity. Data from one representative experiment out of three are shown. (d,e) Soft ECM substrates induce upregulation of keratinocyte differentiation genes, while it downregulates basal/stem markers. Relative mRNA expression values were normalized to the stiff condition for each gene analysed. Bars represent mean+s.d. *P<0.05, **P<0.01, ***P<0.001 compared to siCo.; Student's t-test). See Methods section for reproducibility of experiments. (f) Quantitation of differentiation of nHEK cells transfected with the indicated siRNAs or infected with the indicated lentiviral constructs (as in Fig. 1d,f, respectively), plated on stiff and soft conditions and assayed by qRT–PCR for KRT1 and IVL. Data were normalized to the siYAP/TAZ-transfected cells on stiff (white bar, left) or to the RFP-infected cells on soft (red bar, right). Bars represent mean+s.d. (*P<0.001 compared to siCo., §P<0.001 compared to RFP; one-way analysis of variance). See Methods section for reproducibility of experiments. (g) Confocal images of nHEK cells, stained as in a, plated as sparse or dense cultures. Scale bar: 20 μm. (h) Quantitation of differentiation of nHEK shown in g. Bars represent mean+s.d. (n=3 independent experiments. *P<0.0001; Student's t-test). (i) YAP/TAZ nucleo/cytoplasmic localization was scored as previously described (n=3 independent experiments). (j) nHEK cells infected with the indicated doxycycline-inducible lentiviral constructs were plated to obtain sparse or dense cultures. After 48 h, cells were analyzed by qRT–PCR for keratinocyte differentiation. Data were normalized to the Mock-infected cells in sparse condition. Bars represent mean+s.d. (*P<0.0001 compared to sparse mock, §P<0.0001 compared to dense mock; one-way analysis of variance). See Methods section for reproducibility of experiments.

