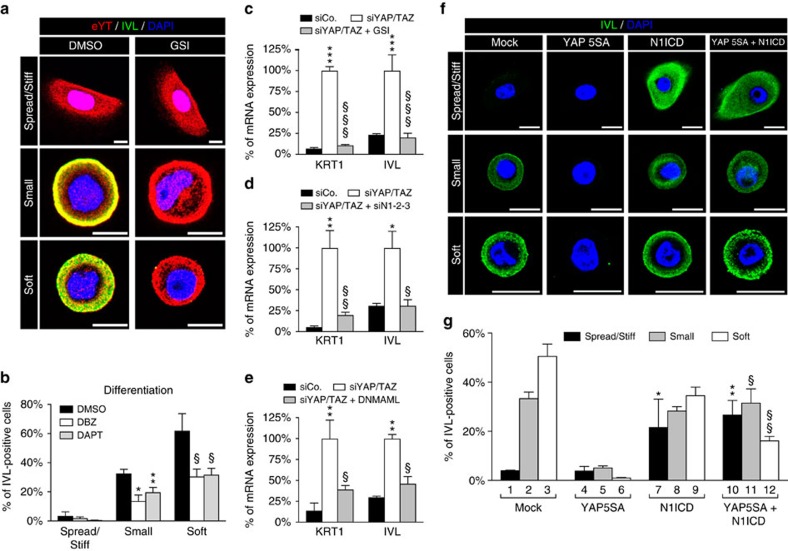
Figure 5. Notch is epistatic to YAP/TAZ and required for mechano-induced epidermal SC differentiation.
(a,b) nHEK cells were seeded for 24 h on fibronectin-coated coverslips (spread/stiff), fibronectin islands of 300 μm2 (small) or fibronectin-coated hydrogels of 1 kPa (soft) and concomitantly treated with control vehicle (DMSO) or with two independent γ-secretase inhibitors (GSIs; DAPT, 20 μM; DBZ, 2.5 μM). (a) Confocal images of cells plated as described and stained for endogenous YAP/TAZ (eYT, red), Involucrin (IVL, green) and nuclear compartment (DAPI, blue). Representative images of cells treated with control vehicle (DMSO) or DBZ (GSI) are shown. Scale bar: 20 μm. (b) Quantitation of differentiation of data shown in a (as in Figs 1 and 2). Bars represent mean+s.d. (n=3 independent experiments. *P=0.009 and **P=0.0003 compared to DMSO-treated cells on small, §P<0.0001 compared to DMSO-treated cells on soft; two-way analysis of variance (ANOVA)). (c–e) nHEK cells transfected with control (siCo.) or YAP/TAZ siRNAs (siYAP/TAZ) were either treated with DBZ GSI (c), cotransfected with a combination of siRNAs targeting Notch1, Notch2 and Notch3 receptors (siN1-2-3) (d) or infected with a doxycycline-inducible lentiviral vector encoding the dominant-negative form of MAML1 (DNMAML) (e). After 48 h from siRNA transfection, cells were analysed by qRT–PCR for KRT1 and IVL. Data were normalized to the control-treated siYAP/TAZ-transfected cells (white bar). Bars represent mean+s.d. (*P<0.01, **P<0.001, ***P<0.0001 compared to siCo; §P<0.01, §§P<0.001, §§§P<0.0001 compared to siYAP/TAZ; two-way ANOVA). See Methods section for reproducibility of experiments. (f) Confocal images showing representative staining for IVL of nHEK cells infected with the indicated constructs and plated on spread/stiff, small or soft conditions. Scale bar: 20 μm. (g) Quantitation of differentiation of nHEK cells treated and stained as in panel (f). Only infected cells were scored for the presence of the Involucrin staining. Bars represent mean+s.d. (n=3 independent experiments. *P≤0.005 lane 7 versus lane 1/4, **P≤0.0005 lane 10 versus lane 1/4, §P<0.0001 lane 11 versus lane 5, §§P=0.02 lane 12 versus lane 6; two-way ANOVA).

