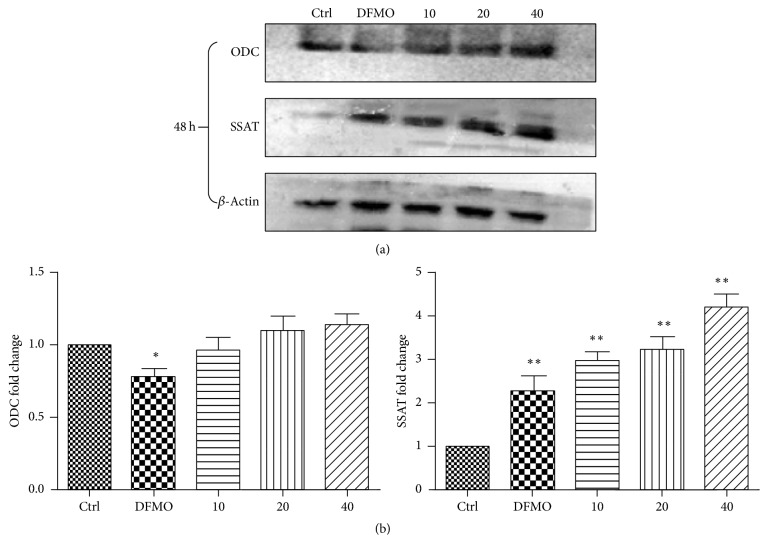
Figure 4.
Western blot analysis and quantification. (a) Western blot analysis of ODC and SSAT protein levels in cells treated with apigenin (10, 20, and 40 μM) and DFMO (2.5 mM) for 48 hours. Twenty-five micrograms of total protein was loaded per lane. SSAT activity was observed at 48 h. There was no significant activation of ODC after apigenin treatment at either concentration. (b) Quantification of ODC and SSAT expression in SW620 cells treated with apigenin (10, 20, and 40 μM) and DFMO (2.5 mM) at 48 h. ∗p < 0.05 and ∗∗p < 0.01 relative to untreated cells.

