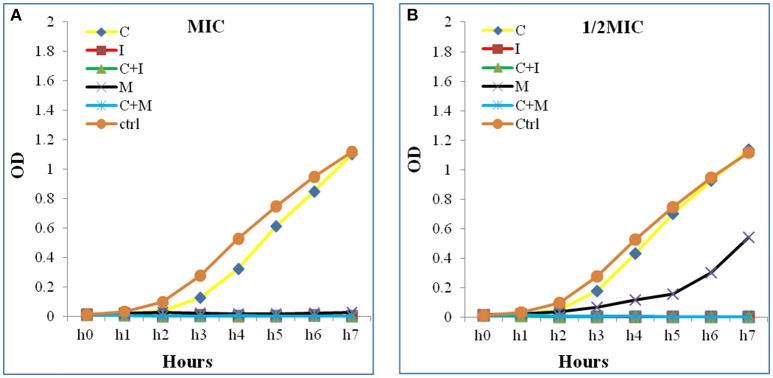
Figure 3.
Time kill curve assay chart showing the synergistic effect of a representative strain (A) at 1 × 1MIC and (B) at 0.5 × 0.5 MIC. A significant decrease in the bacterial growth in both combinations (C+M and C+I) when compared to Colistin alone at 1 × 1 MIC and 0.5 × 0.5 MIC were detected. The Optical density (OD) is represented as a function of time. C, colistin; I, imipenem; C+I, colistin-imipenem; M, meropenem; C+M, colistin-meropenem; Ctrl, control.

