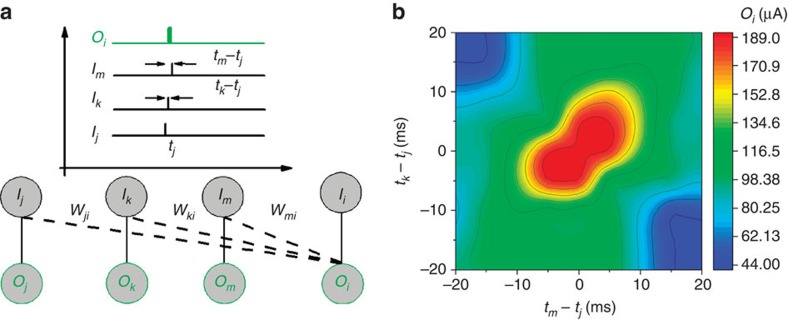
Figure 5. Coincidence detection using soft connections between devices.
(a) Schematic of the measurement protocol. A voltage pulse (amplitude of 0.5 V, width of 10 ms) is applied at three local inputs Ij, Ik, Im with variable time intervals tk−tj and tm−tj with respect to a reference time tj of the input Ij. The output Oi of the ith device is measured for different timing conditions. (b) Time correlation map of the output Oi showing coincidence detection.

