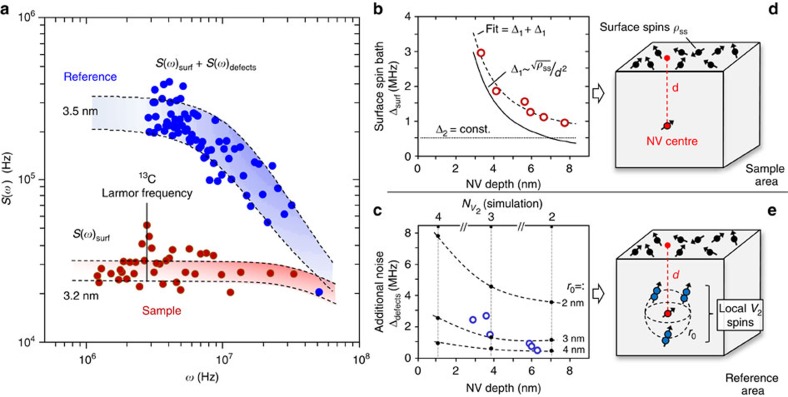
Figure 4. Suppressed magnetic noise for NV centres.
(a) Noise spectra sensed by two NV centres located at the ‘Sample' and ‘Reference' areas at similar depths (∼3 nm), as derived from coherence decay (CPMG pulse sequence, N=32 π-pulses) by means of spectral decomposition technique. The dashed curves and shadowed areas establish margins for fitting the spectra by Lorentzian functions. (b) Extracted coupling strength as a function of depth for NV centres in the ‘Sample' area. The dashed curve is a two-component fit comprising the model of surface spin bath40 (solid curve (1)) and a constant noise contribution (dotted curve (2)). (c) The additional noise component (defects coupling strength) extracted from NV centres in the ‘Reference' area is shown as blue dots. The black dots connected by the dashed curves represent the margins of the noise coupling strength calculated for different numbers of di-vacancy electrons spins. These margins were calculated assuming the simplified modelled NV–V2 configuration depicted in panel (e), which represents residual defects after nitrogen implantation and thermal annealing (see text and Supplementary Note 1 for details). (d,e) Schematic representations of the resulting spin systems around a single implantation-induced NV centre at the ‘Sample' and ‘Reference' areas, respectively.

