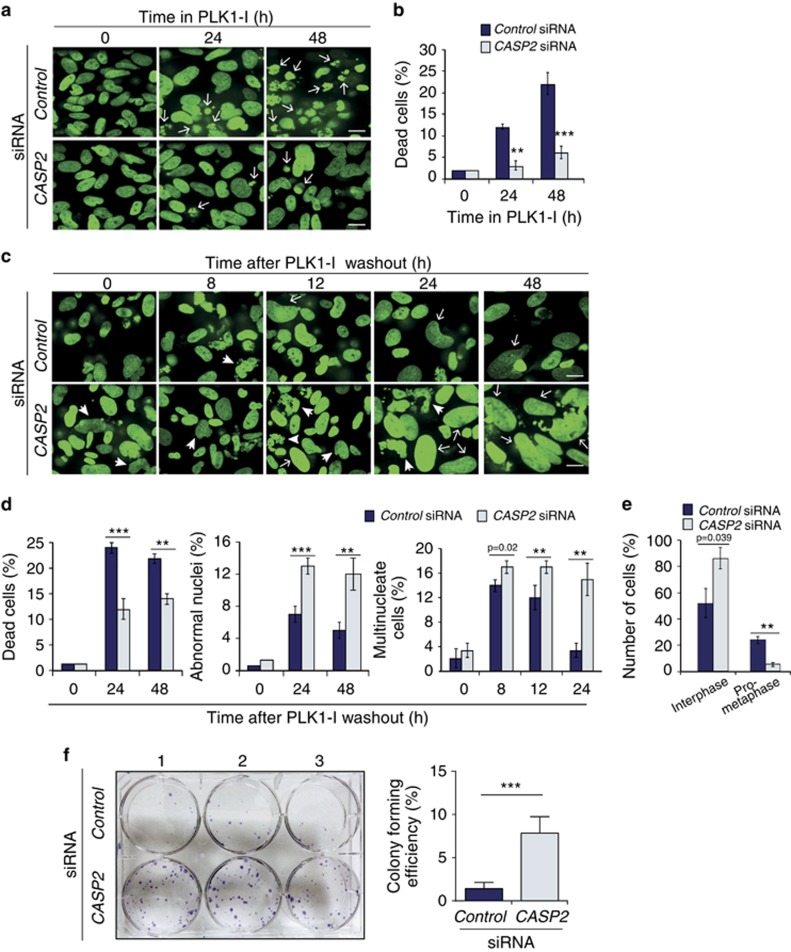
Figure 3.
Acute knockdown of CASP2 affects cell death and promotes accumulation of cells with multiple and abnormal nuclei following PLK1-I addition. (a) Representative images from live cell imaging of GFP-tagged histone H2B expressing U2OS cells treated with Control siRNA or CASP2 siRNA together with PLK1-I at the indicated time points, displaying dead cells (arrows). Scale bar=50 μm. (b) Quantitation of dead cells in U2OS Control siRNA or CASP2 siRNA at indicated time points. Data represented as mean±s.d. from three independent experiments. P values are indicated with **P<0.01, ***P<0.001. (c) Representative images from live cell imaging of H2B-GFP U2OS cells treated with Control siRNA or CASP2 siRNA at the indicated time points following PLK1-I washout, displaying multinucleated cells (arrows) and cells with abnormally large nuclei (arrow heads). Scale bar=50 μm. (d) Quantitation of dead cells, multinucleated cells and cells with abnormal nuclei at indicated time points following PLK1-I washout. Data represented as mean±s.d. from three independent experiments. P values are indicated with **P<0.01, ***P<0.001. (e) Quantitation of cell cycle events following PLK1-I induced mitotic arrest. Data represented as mean±s.d. from three independent experiments. P values are indicated with **P<0.01. (f) Clonogenic assay. Representative image of crystal violet stained colonies in Control or CASP2 siRNA-transfected U2OS cells treated with PLK1-I (100 nM) for 48 h and cultured over 11 days. Experiment was carried out in triplicate and the colony was defined to consist of at least 50 cells. Quantitation of colony forming efficiency from three independent experiments is shown. Data represent mean±s.e.m. ***P<0.001.

