Figure 6.
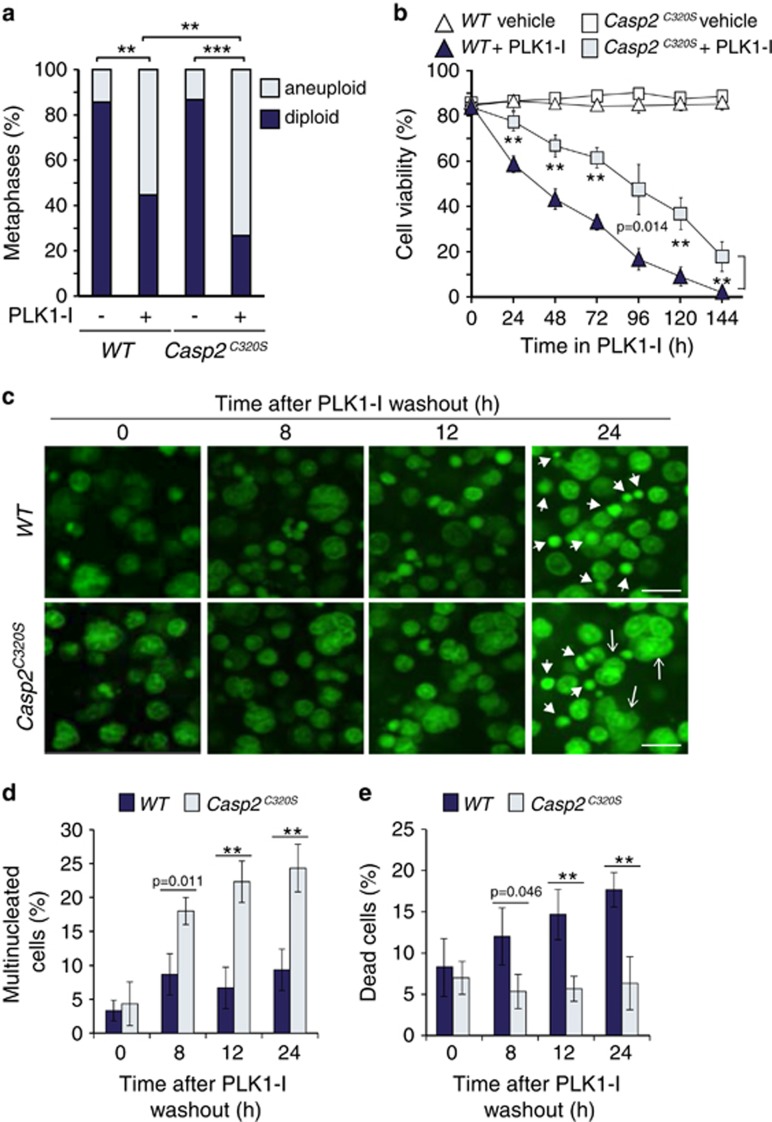
Caspase-2 catalytic cysteine mutant enhances aneuploidy. (a) Quantitation of metaphases showing frequencies of diploid and aneuploid karyotypes in untreated and PLK1 inhibitor (PLK1-I) treated WT (n=3) and Casp2C320S/C320S (designated as Casp2C320S) (n=3) splenocytes. A total of 50 metaphase spreads were counted per mouse. P values are indicated with **P<0.01, ***P<0.001, χ2 test. (b) Quantitation of viable cells in WT and Casp2C320S splenocytes treated with PLK1-I for the indicated time points, determined by trypan blue assay. Data represented as mean±s.e.m. from three independent experiments. P values are indicated with **P<0.01. (c) Representative images from live cell imaging of WT and Casp2C320S splenocytes stained with Acriflavine, showing cells with multiple nuclei (arrows) and dead cells (arrow heads) at the indicated time points following PLK1-I treatment. Scale bar=50 μm. (d, e) Quantitation of multi nucleated cells (d) and dead cells (e) at the indicated time points, following PLK1-I washout. Data represented as mean±s.d. from three independent experiments. P values are indicated with **P<0.01, ***P<0.001.

