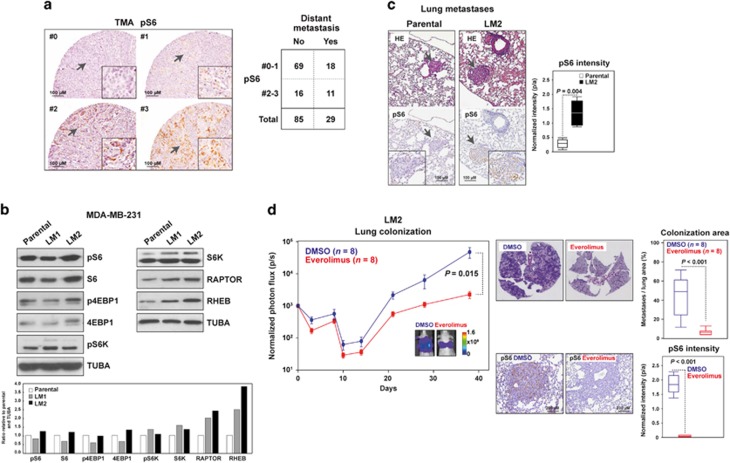
Figure 1.
mTORC1 activity concurrent with enhanced metastatic potential. (a) Left panels, representative immunohistochemical scores (0, negative, to 3, highest expression) of pS6 staining in the tissue microarray (TMA) of primary breast tumors. Right panel, results for the association between pS6 staining and distant metastasis. (b) Increased expression of mTORC1 pathway components with enhanced metastatic potential of MDA-MB-231 cells. The loading control (α-tubulin, TUBA) is shown. Bottom panel, graph showing quantifications of protein levels relative to parental and TUBA (per sample). (c) Increased pS6 expression in lung metastases developed by LM2 cells. The arrows mark magnified fields. Right panel, box-and-whisker plots for the quantification (pixels/area, p/a) of pS6 intensity; three mice and three similar lung metastases were analyzed in each setting. The P-value of the two-tailed Mann–Whitney test is shown. (d) Left panel, graph showing the in vivo photon flux quantification in mice injected with LM2 and treated with DMSO or everolimus. Representative images from bioluminescence in lungs from DMSO- or everolimus-treated mice are shown. The scale bar depicts the range of photon flux values as a pseudo-color display, with red and blue representing high and low values, respectively. Right top panels, quantification of lung colonization (total metastasis area normalized per total lung area, based on HE). Right bottom panels, representative immunohistochemical results for pS6 and quantification of normalized intensities.

