Figure 4.
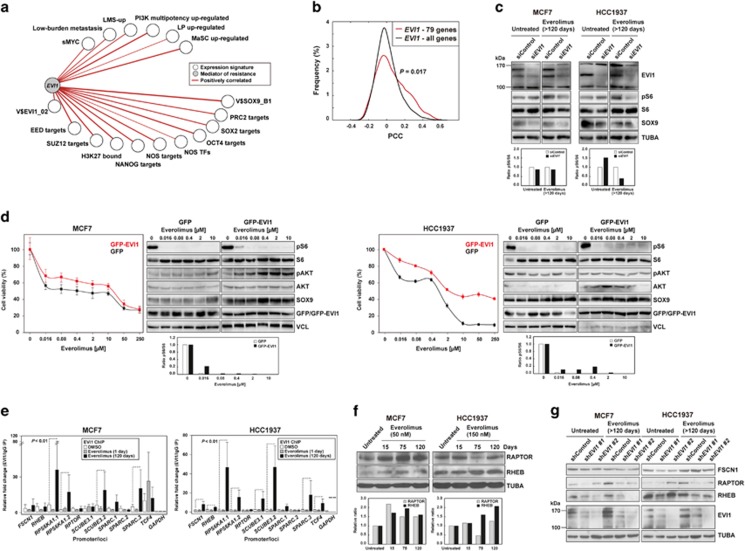
EVI1 couples stemness, metastatic potential and resistance to mTOR inhibition. (a) TCGA network of significant co-expression (PCC P-values <0.05) between EVI1 and signatures derived from stem cell-like cells and/or metastatic settings (Supplementary Table 1). (b) Distributions of PCCs between EVI1 and the commonly overexpressed 79 genes across the studied models or the complete microarray gene list as background control. The P-value of the Mann–Whitney test for the comparison of the distributions is shown. (c) Reduced pS6 levels with EVI1 depletion in cell models. The quantification of pS6/S6 signal ratios is show at the bottom (relative to siControl). (d) Ectopic overexpression of GFP-EVI1 in MCF7 (left panels) and HCC1937 (right panels) cells provides higher viability upon exposure to everolimus, relative to GFP-only overexpression. Also shown are the western blot results for defined markers across the drug-exposed cell cultures. The quantification of pS6/S6 signal ratios is show at the bottom (relative to TUBA per sample). (e) Increased EVI1 binding at predicted target promoters/gene loci with adaptation to everolimus. The fold changes are relative to the immunoglobulin control and the promoter gene targets are shown in the X axis. (f) Relative overexpression of RAPTOR and/or RHEB with adaptation to everolimus in MCF7 and HCC1937 cells. The quantification is show at the bottom (relative to untreated and TUBA per sample). (g) Relative reduction of RAPTOR and RHEB expression following EVI1 depletion, in particular in the everolimus-adapted setting.

