Figure 5.
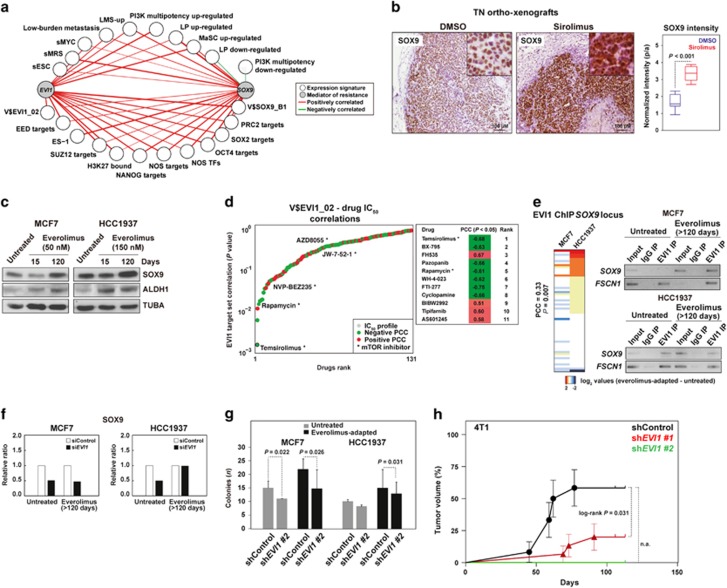
EVI1 cooperates with SOX9 and regulates its expression. (a) TCGA network of significant co-expression (PCC P-values <0.05) between EVI1 or SOX9 and signatures derived from stem cell-like cells and/or metastatic settings (Supplementary Table 1). (b) Increased SOX9 expression in ortho-xenograft tumor fronts of mice treated with sirolimus; the results correspond to at least three ortho-xenografts of each group. (c) Increased SOX9 and ALDH1 expression in everolimus-adapted cells. (d) Graph showing the results from the analysis of the complete drug panel for the correlation between IC50 profiles and the expression of the V$EVI1_02 gene set; drugs are ranked according to PCC log P-values. Negative and positive PCCs are indicated with different colors, and the mTOR inhibitors in the panel are denoted. (e) Left panel, unsupervised clustering and correlation analysis of the difference in EVI1 ChIP results at the SOX9 locus between everolimus-adapted and untreated cells. Right panels, results of ChIP assays targeting a predicted EVI1-binding site in the SOX9 promoter (Supplementary Table 5); the input, control immunoglobulin immunoprecipitation (IP), and EVI1-IP results are shown. The control results for the binding site in FSCN1 are also shown. (f) Depletion of EVI1 leads to a reduction of SOX9 expression in three cell conditions (the results correspond to Figure 4c; the ratios are relative to siControl and TUBA per sample). (g) Depletion of EVI1 leads to a reduction of colony-forming capacity. The results of the one-tailed t-test are shown. (h) Depletion of Evi1 impairs the tumorigenic potential of 4T1 cells. The log-rank P-value is shown for the comparison between the shControl and short hairpin RNA (shRNA)-EVI1 #1; note that transduction with shRNA-EVI1 #2 completely impaired tumor formation so a P-value could not be computed (n.a.).

