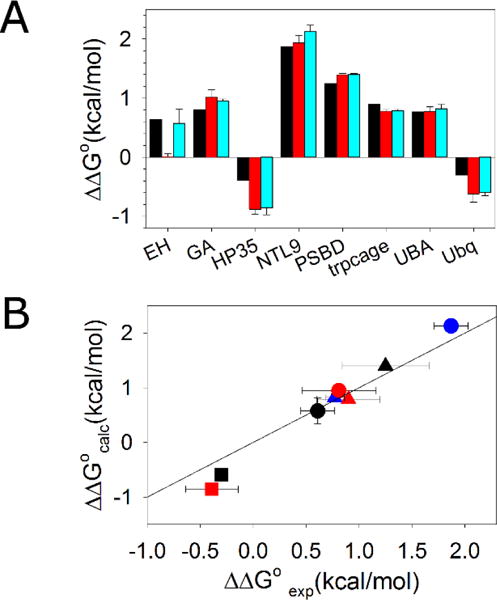
Figure 2.

Thermodynamic integration reproduces experimental values of ΔΔG°. (A) Experimental ΔΔG° values are shown in black. Calculated ΔΔG° values using experimental structures as starting structures are shown in red. Calculated ΔΔG° values using the last frames of 50 ns simulations as the starting structures are in cyan. (B) A scatter plot of experimental ΔΔG° and calculated ΔΔG° values using the last frames of a 50 ns simulation as the starting structure. Solid line represents ΔΔG°exp = ΔΔG°cal. EH ●; GA
 ; HP35
 ; NTL9
 ; PSBD ▲; Trp-cage
 ; UBA
; UBA
 ; Ubiquitin ■. The calculated value for the EH domain used in the plot was derived by using the unrestrained MD structure as the starting structure for the TI calculation. Positive ΔΔG° values indicate stabilization.
