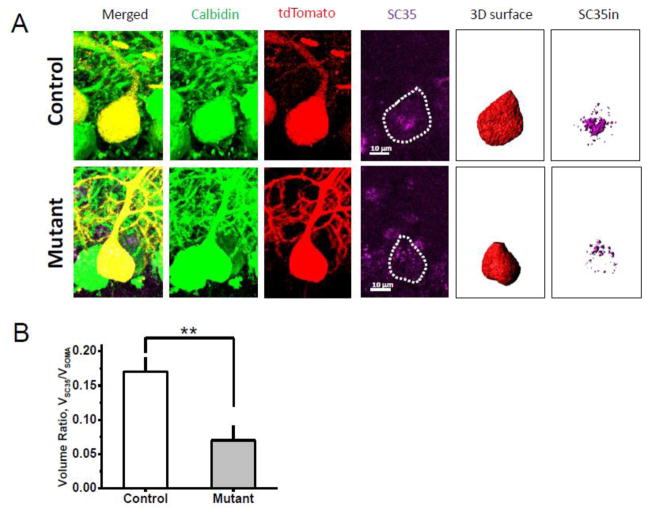
Figure 4. Decreased expression of the splicing factor, SC35, in mutant PCs.
a) Representative images of immunostaining of PCs of control-tdTom mice (Control; the upper row) and mutant DISC1-tdTom mice (Mutant; the bottom row); anti-MCherry staining (red) anti-Calbindin staining (green); and anti-splicing factor SC35 (purple, PC somas are outlined with dotted lines); scale bar – 10 μm; using MCherry (tdTomato) channel, we created the entire surface of the soma of a PC (3D surface) and generated a new “SC35in” channel that included SC35-ir (purple) signal within the 3D surface of the PC soma and calculated SC35in volume;
(b) Quantitative analysis of SC35-ir in PC presented as the ratio of volume of the SC35-ir within the PC (i.e., 3D volume) to total volume of the soma of the selected tdTom+ PC; decreased SC35 volume ratio was detected in mutant DISC1 PCs compared to control PCs control – control-tdTom mice (n=17 PCs from 3 mice); mutant–mutant DISC1-tdTom mice (n=11 PCs from 3 mice); * denotes p=0.0018 vs. control mice.

