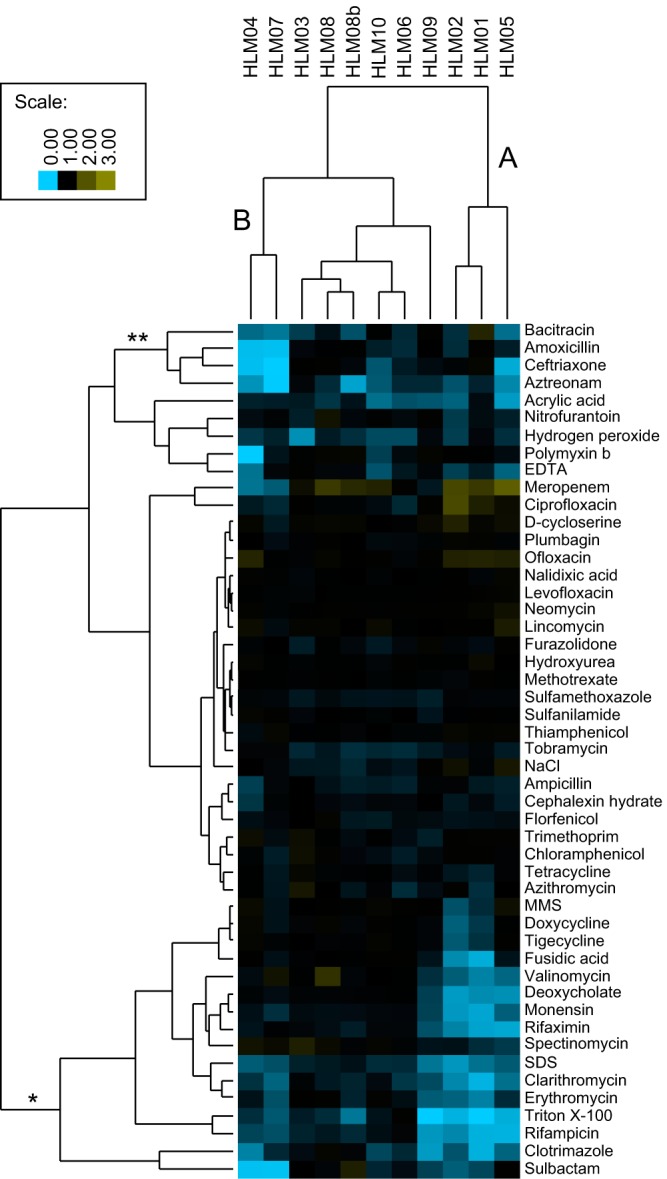
FIG 2 .

Chemical sensitivity analysis of HL mutants. Cluster A shows increased sensitivity to a group of compounds that report on membrane integrity (*). Cluster B shows increased sensitivity to a group of peptidoglycan active compounds (**). The color scale indicates relative fitness compared to the parent strain. A value of 1 (black) indicates no change relative to the parent, <1 (blue) indicates increased sensitivity to the compound, and >1 (yellow) indicates increased resistance to the compound. MMS, methyl methanesulfonate.
