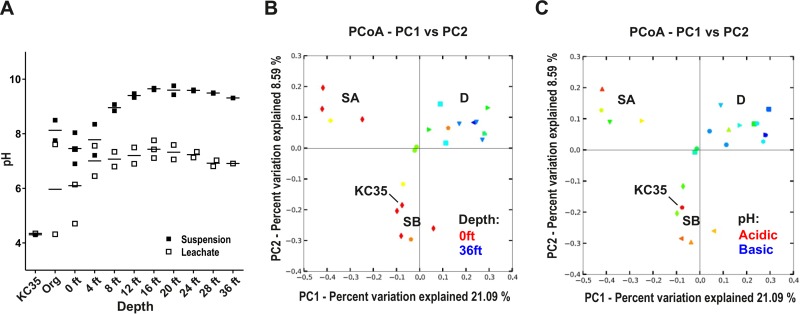
FIG 2 .
KC communities cluster into three types (SA, SB, and D) according to depth and pH. (A) The pH of KC samples varies with depth. The pH of either fresh aqueous suspensions or prepared aqueous leachates of each sample was measured. The measurement for each individual sample, as well as the mean, is plotted. (B and C) Principal-coordinate analysis of core sample communities. Communities for each core sample were clustered using principal-coordinate analysis (PCoA) of unweighted UniFrac distances obtained from 16S rRNA amplicon sequencing. In panel B, symbols representing each KC sample are colored according to a gradient representing depth. In panel C, symbols are colored according to a gradient representing their aqueous leachate pH (acidic [pH ~4] to basic [pH ~9]). PC1, principal component 1.

