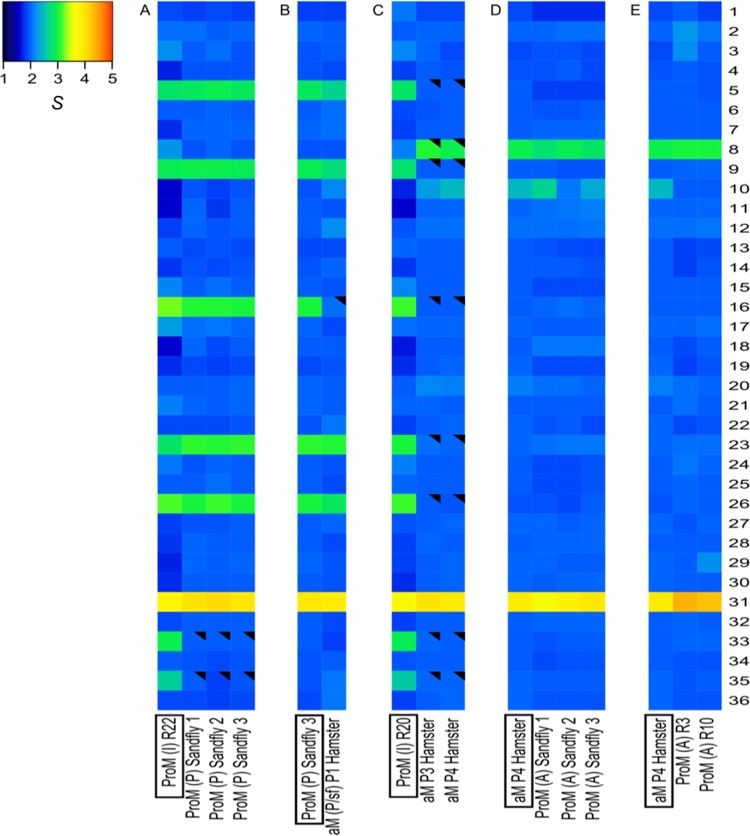
FIG 2 .
Dynamics of aneuploidy of L. donovani BPK282/0 during adaptation to different in vitro and in vivo environments. (A) Promastigotes reisolated from sand flies. (B) Amastigotes during short-term adaptation. (C) Amastigotes during long-term adaptation. (D and E) Promastigotes reisolated from sand flies infected by hamster-derived amastigotes (D) and during adaptation to in vitro culture of amastigote-derived promastigotes (E). Heat maps show median normalized read depths of chromosomes found within each cell population for each of the 36 chromosomes (y axis) and each sample (x axis). The color key shows the normalized chromosome read depth (S) and the distribution frequency. S ranges are as follows: monosomy, S < 1.5 (dark blue); disomy, 1.5 ≤ S < 2.5 (light blue); trisomy, 2.5 ≤ S < 3.5 (green); tetrasomy, 3.5 ≤ S < 4.5 (orange); pentasomy, 4.5 ≤ S < 5.5 (red). A filled black triangle in an upper right corner indicates a significant change of S (≥0.5, with a shift from one S range to another and a P value of ≤10−5) in comparison to the S value of the sample framed in a black box at the bottom.

