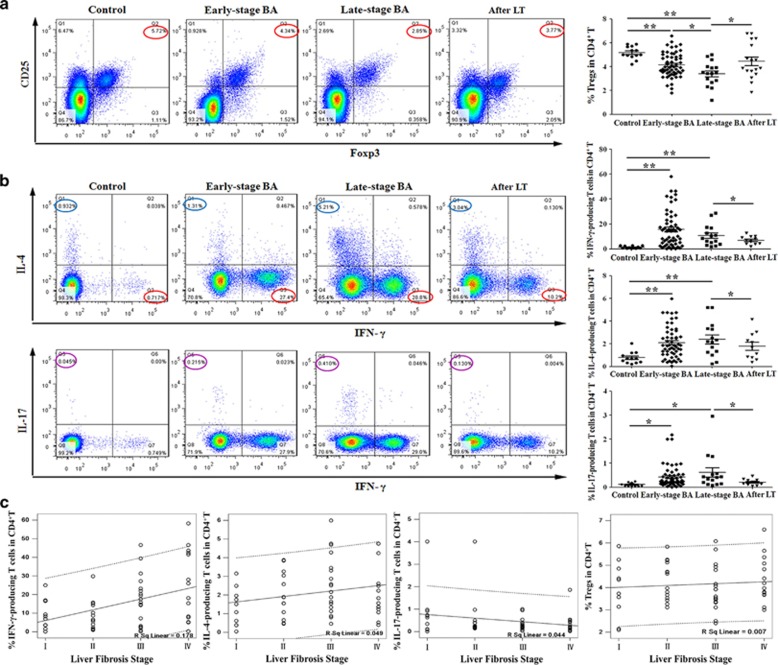
Figure 1.
Proportions of Tregs, Th1, Th2 and Th17 cells in BA patients at various stages and their correlations with liver fibrosis. (a) Flow cytometry of PBMCs gated on CD4+ T cells. Numbers circled in red indicate percentages of CD25+FoxP3+ Treg in CD4+ T cells. The results of representative patients are shown in the first four panels, and the compiled results from all patients are shown in the last panel. Horizontal bars indicate mean±S.D. (b) Flow cytometry of PBMCs gated on CD4+ T cells. Left panels: detection of IFN-γ-producing (Th1) or IL-4-producing (Th2) cells in representative patients (top row); detection of Th1 or IL-17-producing (Th17) cells in representative patients (bottom row). Numbers indicate percentages of Th1 (red circle), Th2 (blue circle) and Th17 (purple circle) cells. Right panels: compiled results from all patients. Horizontal bars indicate mean±S.D. *P<0.05; **P<0.01. (c) Pearson correlation was performed between proportions of peripheral Th1, Th2, Th17 or Tregs in CD4+ T cells and the stage of liver fibrosis in 56 early-stage BA patients

