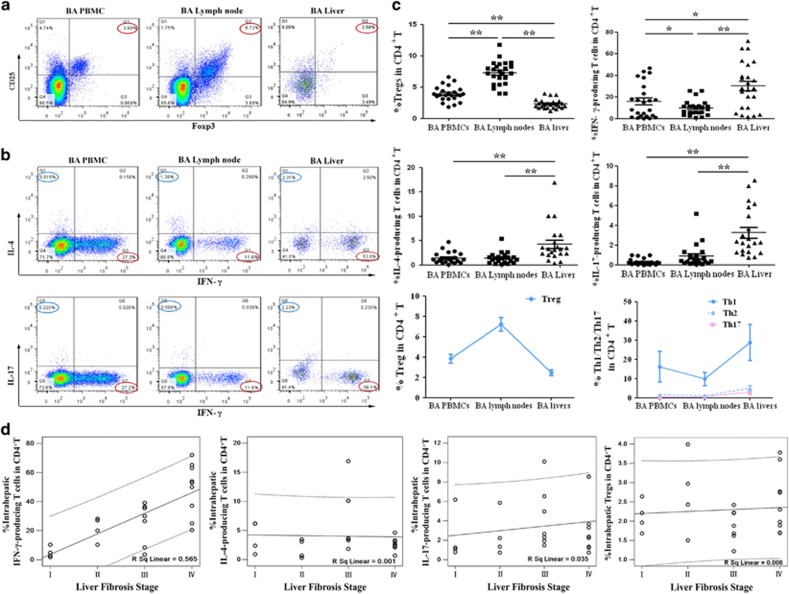
Figure 2.
Comparison of the proportions of Tregs and Th cells in BA livers, lymph nodes and PBMCs. (a) Expression of CD25+FoxP3+ Treg in CD4+ T cells. (b) Detection of Th1 or Th2 cells in representative patients (top row); detection of Th1 or Th17 cells in representative patients (bottom row). Numbers indicate percentages of Th1 (red circle), Th2 (blue circle) and Th17 (purple circle) cells. (c) First and second rows: compiled results from 24 early-stage BA patients. Horizontal bars indicate mean±S.D. Third row: changing trends of Tregs (left panel) and Th cells (right panel). *P<0.05; **P<0.01. (d) Pearson correlation was performed between proportions of intrahepatic Th1, Th2, Th17 or Tregs in CD4+ T cells and the stage of liver fibrosis in 24 early-stage BA patients

