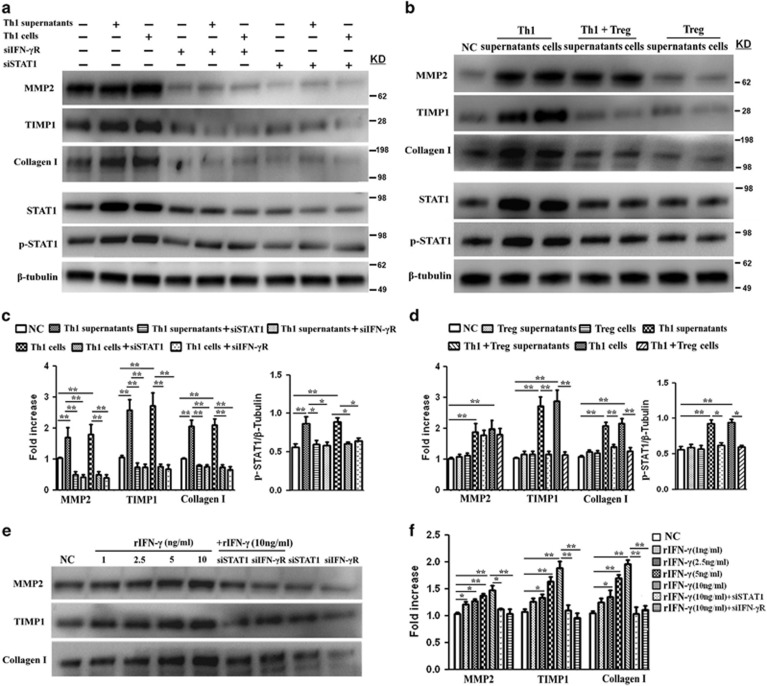
Figure 5.
Expression of profibrogenic markers TIMP1, MMP2 and collagen I in HSC supernatants. (a and b) HSCs were treated as described in Figure 4a. Top panel: the level of profibrogenic markers TIMP1, MMP2 and collagen I in HSC supernatants was assessed by western blot analyses. Bottom panel: HSC lysates were assessed for STAT1, p-STAT1 and β-tubulin expression. (c and d) Quantification of western blot results shown in (a or b). Values represent means±S.D. of 12 independent experiments (*P<0.05; **P<0.01). (e) Detection of profibrogenic markers TIMP1, MMP2 and collagen I in HSC supernatants after rIFN-γ treatment for 24 h. (f) Quantification of western blot results shown in (e) (*P<0.05; **P<0.01)

