Figure 6.
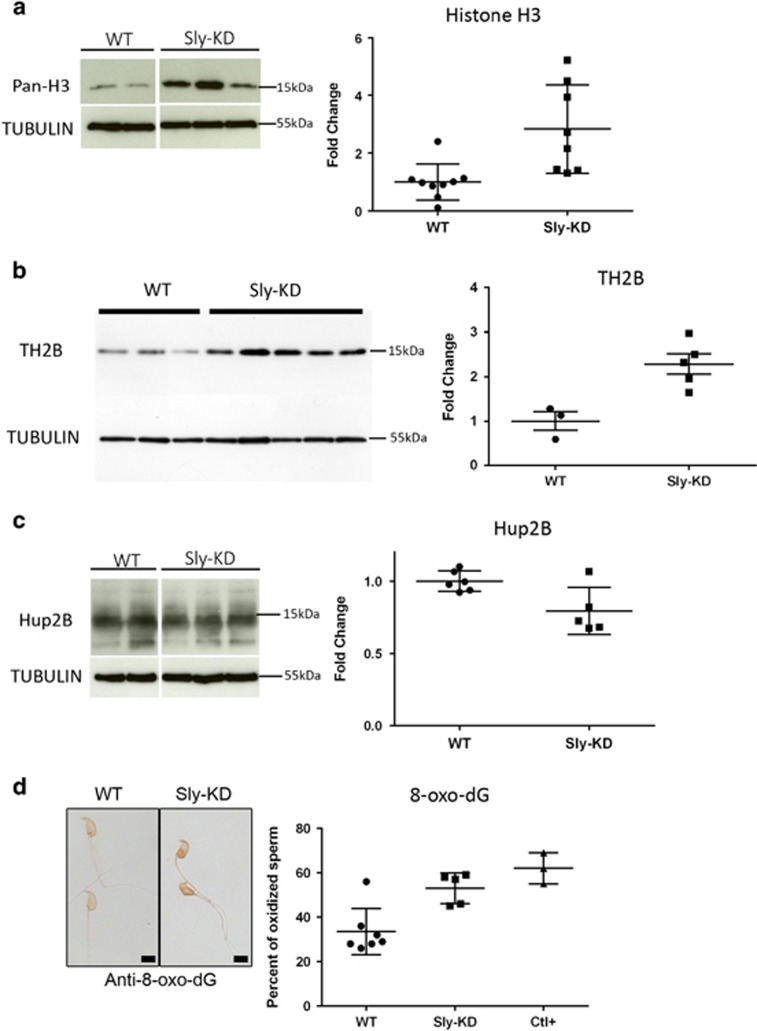
Sly deficiency leads to abnormal chromatin content and increased DNA oxidation in spermatozoa. (a) Western blot quantification of histone H3 (using anti-pan-H3) in protein extracts from WT and Sly-KD spermatozoa. Antibody against TUBULIN was used to normalize the signal. The scatter plot on the right represents histone H3 level normalized with TUBULIN (mean value ±S.D.). The difference between the two genotypes is statistically significant (t-test on 8–9 samples per genotype, P=0.0047). (b) Western blot detection and quantification of TH2B in protein extracts from WT and Sly-KD spermatozoa. Antibody against TUBULIN was used to normalize the signal. The right panel is a scatter plot showing quantification of TH2B (normalized to TUBULIN level) in Sly-KD and WT spermatozoa. The graph represents the mean level ±S.E.M. The difference between the two genotypes is statistically significant (t-test, n=3–5 samples per genotype, P=0.009). (c) Western blot quantification of protamine 2 (using anti-Hup2B) in protein extracts from WT and Sly-KD spermatozoa. Antibody against TUBULIN was used to normalize the signal. The scatter plot on the right represents Protamine 2 level normalized with TUBULIN (mean value ±S.D.). The difference between the two genotypes is statistically significant (t-test on 5–6 samples per genotype, P=0.0199). The variability was elevated among Sly-KD samples and when excluding one outsider value, the P-value dropped to 0.0003. (d) Representative pictures obtained using antibody against 8-oxo-dG in WT and Sly-KD epididymal spermatozoa. WT picture shows two 8-oxo-dG negative spermatozoa while Sly-KD picture shows two 8-oxo-dG positive spermatozoa. Pictures were taken using the same image capture parameters. Scale bar indicates 5 μm. The scatter plot on the right represents the percentage of oxidized spermatozoa (mean ±S.D.) measured using antibody against 8-oxo-dG. Ctl+ indicates values obtained when spermatozoa were pre-incubated with H202 (positive control). Mann–Whitney nonparametric test showed significant difference between WT and Sly-KD samples (5–7 samples per genotype, P= 0.01) and between WT and Ctl+ (P=0.025)

