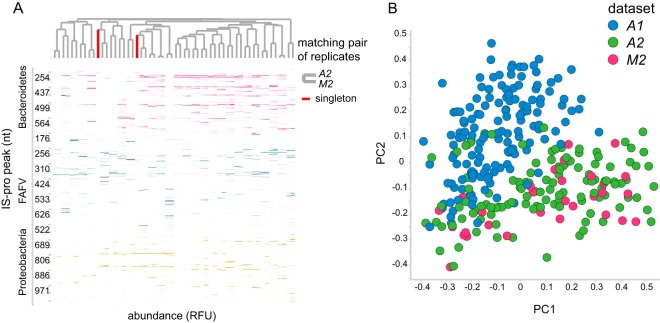
FIG 2.
Replicate sample comparison. (A) Heat map of between-hospital replicates. Pairwise clustering is observed for all samples except one. Columns correspond to samples, and rows correspond to peaks (i.e., bacterial species). Clustering is based on the cosine correlation matrix of peak intensities by the unweighted pair group method using average linkages. nt, nucleotides. (B) Principal-coordinate analysis of samples of the original data set (A1) and its two replicates (A2 and M2). Samples are primarily grouped by analysis platform. Samples represented by green and pink dots were analyzed with the same machine model (ABI 3500 genetic analyzer), while samples represented by blue dots were analyzed with a different machine model (ABI PRISM 3130 genetic analyzer). The hospital is not a large source of variation. Samples represented by blue dots were analyzed in the same lab in Amsterdam, The Netherlands, while samples represented by pink dots were analyzed in a different lab in Maastricht, The Netherlands. The principal-coordinate analysis was based on between-sample cosine distances.

