
FIG 4.
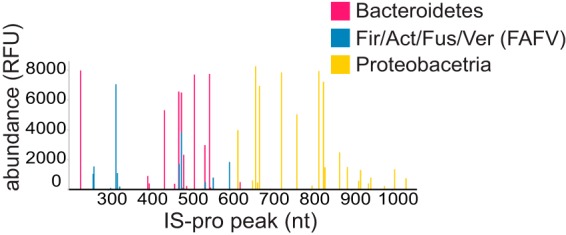
An IS-pro microbial profile example. Each sample in this study is represented as a microbial profile composed of peaks that correspond to different IS fragments. The IS fragment length (nucleotides [nt]) is depicted on the x axis, and bacterial species abundance is displayed on the y axis. Colors correspond to bacterial phylum group as amplified by IS-pro. Fir, Firmicutes; Act, Actinobacteria; Fus, Fusobacteria; Ver, Verrucomicrobia.