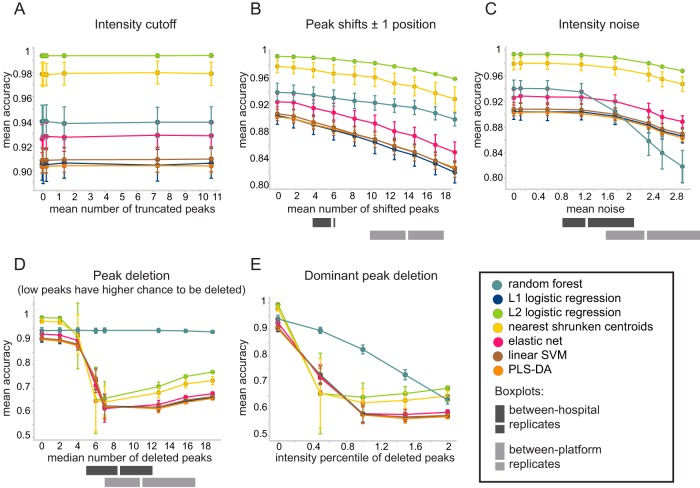
FIG 5.
Effects of perturbations on the predictive accuracy of the SIM data set. Each panel represents the effect of a different perturbation, simulated with increased extent (depicted on the x axis) in the SIM data set. Training sets of 400 samples were repeatedly subsampled 100 times from the SIM data set, while the rest of the samples served as a test set. Classifiers were trained on unperturbed data and tested on perturbed data. Colors correspond to different classifiers. Gray bars reflect the actual observed amounts of between-hospital perturbations (between replicates A2 and M2, dark gray) and between-platform perturbations (between replicates A2 and A1, light gray). The perturbations tested were as follows: P1, intensity cutoff (A); P2, peak shifts (B); P3, intensity noise (C); P4, peak deletion (D); P5, dominant peak deletion (E). They are further elaborated in Table 1.

