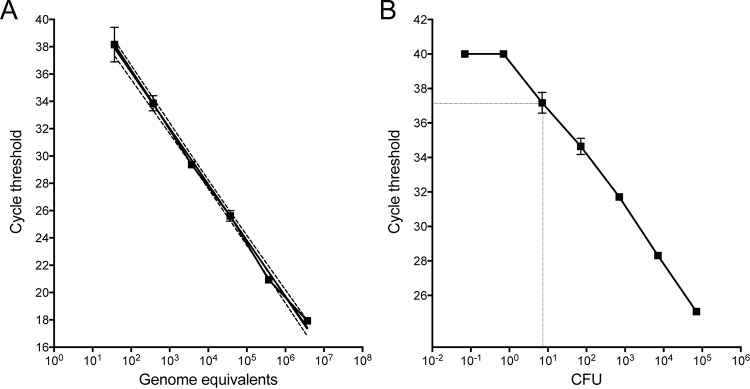
FIG 3.
Sensitivity testing of 1970-P TaqMan PCR for M. chimaera. (A) Standard curve showing CT values versus M. chimaera 10-fold serial dilutions, expressed as genome equivalents (log scale). Means and standard deviations for triplicate DNA preparations for assay 1970-P are shown. A curve was interpolated using linear regression (R2 = 0.992). Dotted lines indicate 95% confidence intervals. (B) Detection sensitivity of 1970-P for detection of M. chimaera spiked into whole blood, indicating a limit of detection of 10 CFU. Means and standard deviations for triplicate blood samples and DNA extractions for each dilution are shown.

