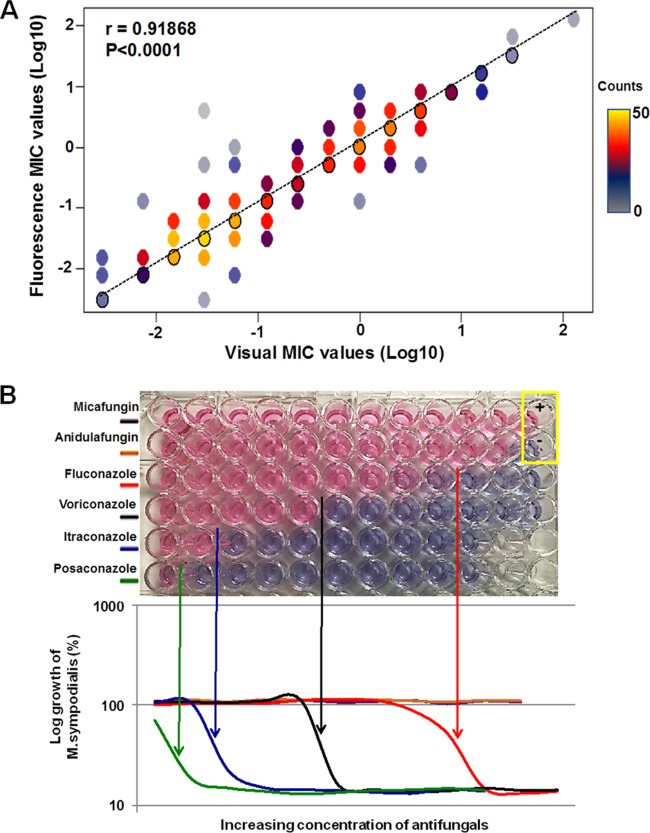
FIG 1.
(A) MIC values of antifungals (except griseofulvin and echinocandins) for 52 Malassezia strains, determined by visual readings (x axis) and fluorescence readings (y axis). Black circles represent points at which the two data readings were in 100% agreement. The number of MIC values per data point in the graph is indicated by the color bar. Agreement between visual and fluorescence readings was determined by Pearson correlation analysis. (B) Agreement between MIC values determined by visual readings and fluorescence readings from a representative antifungal resistance assay plate testing M. sympodialis. Each row represents a particular antifungal, with concentrations increasing from left to right. In the yellow box, the plus sign indicates the positive control without antifungal and the minus sign indicates the negative control containing broth medium without M. sympodialis. Pink wells indicate the growth of M. sympodialis, and blue wells indicate no growth. The graph represents the fluorescence readings of the color changes.

