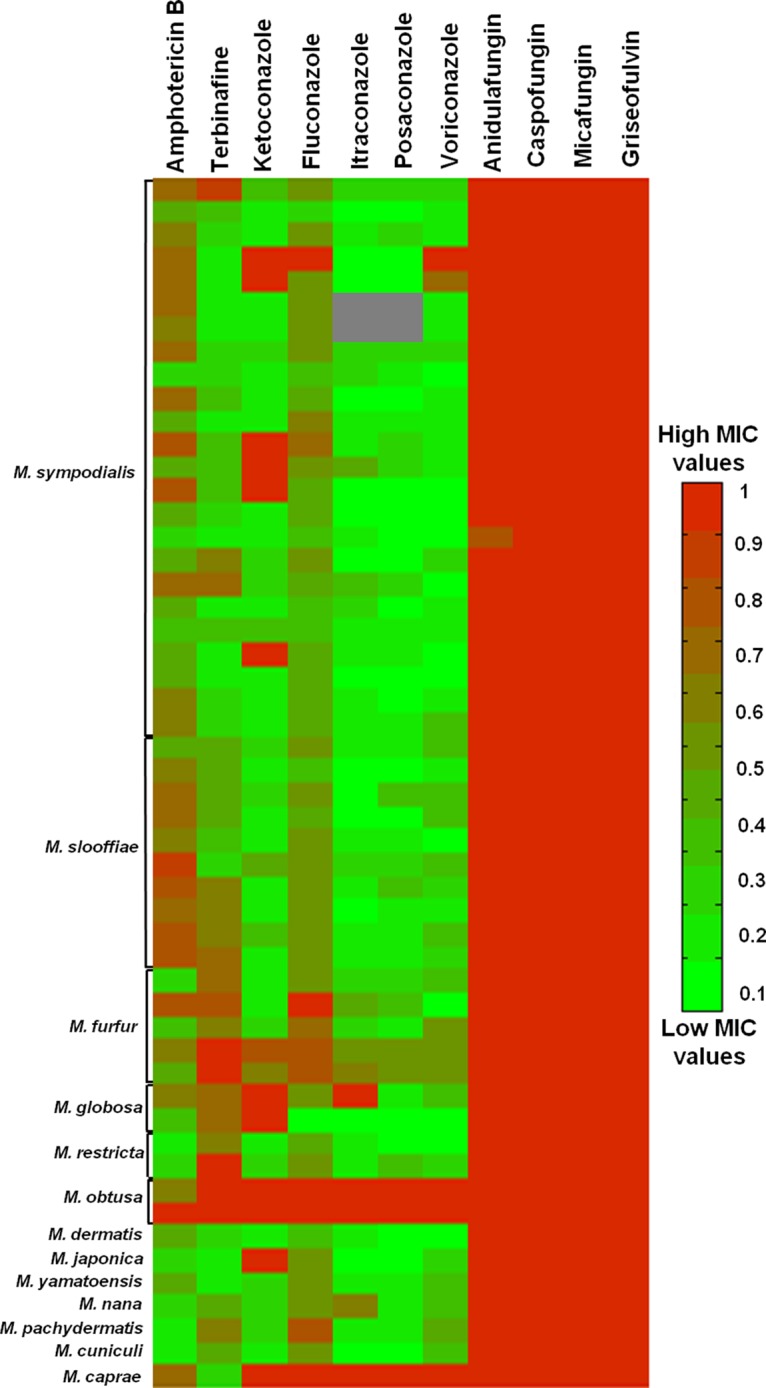
FIG 2.

MIC values of 11 antifungals for 52 Malassezia strains, as determined by visual readings. MIC values were normalized from 0 to 1, with 1 being the highest antifungal concentration tested. The first row for each Malassezia species represents the susceptibility profile of the reference strain. Gray sections indicate inconclusive MIC results.
