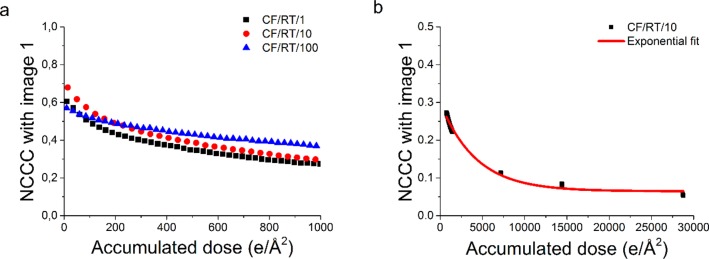
Figure 4.
(a) Cross-correlation coefficient with respect to the first image of three dose series (1, 10, and 100 e/(Å2 s)) as a function of accumulated dose. For visibility reasons, every third data point is shown. (b) Cross-correlation coefficient with the first image of a dose series acquired at 10 e/Å2 at room temperature, starting at 750 e/Å2. An exponential fit is added to calculate the critical dose.

