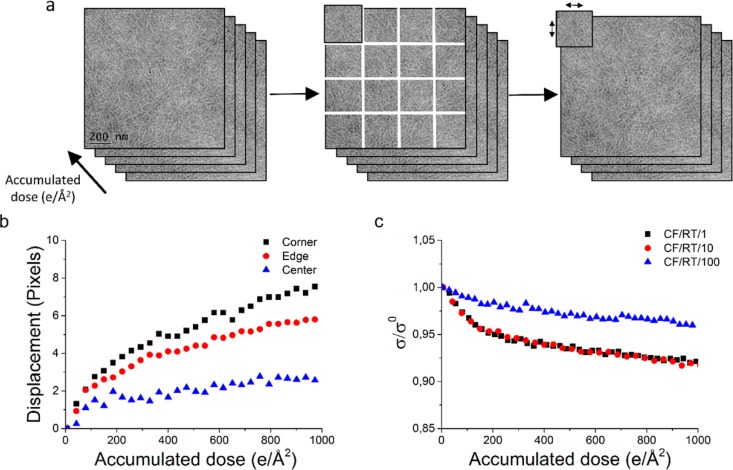
Figure 5.
(a) Schematic representation of cutting a stack of images in 16 parts (left to middle) and using the cross-correlation to find the shift in 1 part of the image compared to the original image (right), as a representation of shrinkage or expansion. (b) The average shift of the 4 corner subareas, the 8 edge subareas, and the 4 center subareas, acquired at 10 e/(Å2 s). (c) Relative decrease in standard deviation of the mean intensity as a function of accumulated dose for samples prepared by the common floating approach at room temperature, at three different dose rates. For visibility reasons, every fifth data point is shown in (b) and (c).

