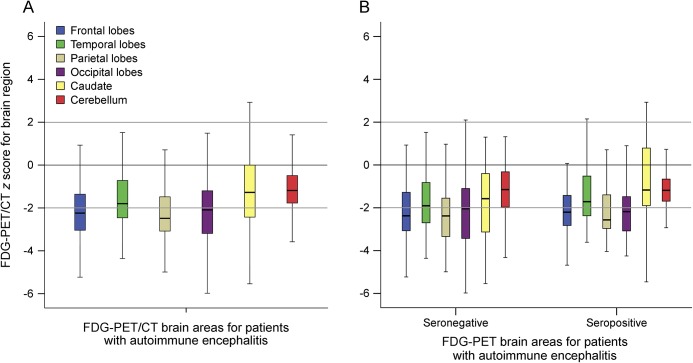
Figure 2. Metabolism across brain regions in AE.
Boxplots of Z-scores for FDG-avidity for brain areas on dedicated FDG-PET/CT for (A) patients meeting consensus criteria for AE, (B) seronegative and seropositive patients meeting the consensus criteria for AE. Z-scores varied across brain regions for patients with AE (p < 0.005), with values for the caudate being greater than those for frontal (p < 0.005), temporal (p = 0.002), parietal (p < 0.005), and occipital (p < 0.005) lobes. No difference was noted between seronegative and seropositive patient groups (p = 0.08). AE = autoimmune encephalitis.

