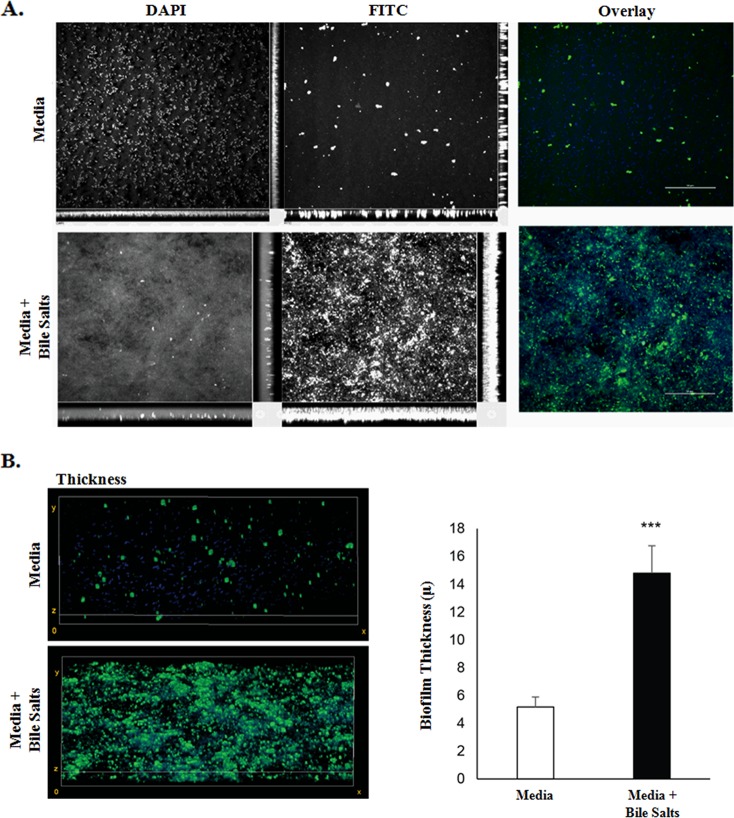
FIG 4.
Analysis of exopolysaccharide matrix production. (A) S. flexneri 2457T was grown on glass coverslips in TSB ± 0.4% (wt/vol) bile salts, fixed, and stained with DAPI (blue) and 25 μg/ml FITC-conjugated concanavalin A (green) to assess EPS production. Bacteria in medium alone were dispersed and had few areas staining positive for concanavalin A, while bacteria exposed to bile salts clumped and had more concanavalin A staining. The images are representative of three independent experiments. (B) To quantify the thickness of the biofilms, image stacks were taken every 0.25 μm of the biofilm, and quantification was determined from the full thickness of the stack. The image on the left represents 3D reconstructed stacks using ImageJ software. The average thickness (±SE) of each biofilm from three independent experiments is plotted on the right. There was a significant difference in biofilm thickness of S. flexneri 2457T following exposure to bile salts (***, P < 0.01).

