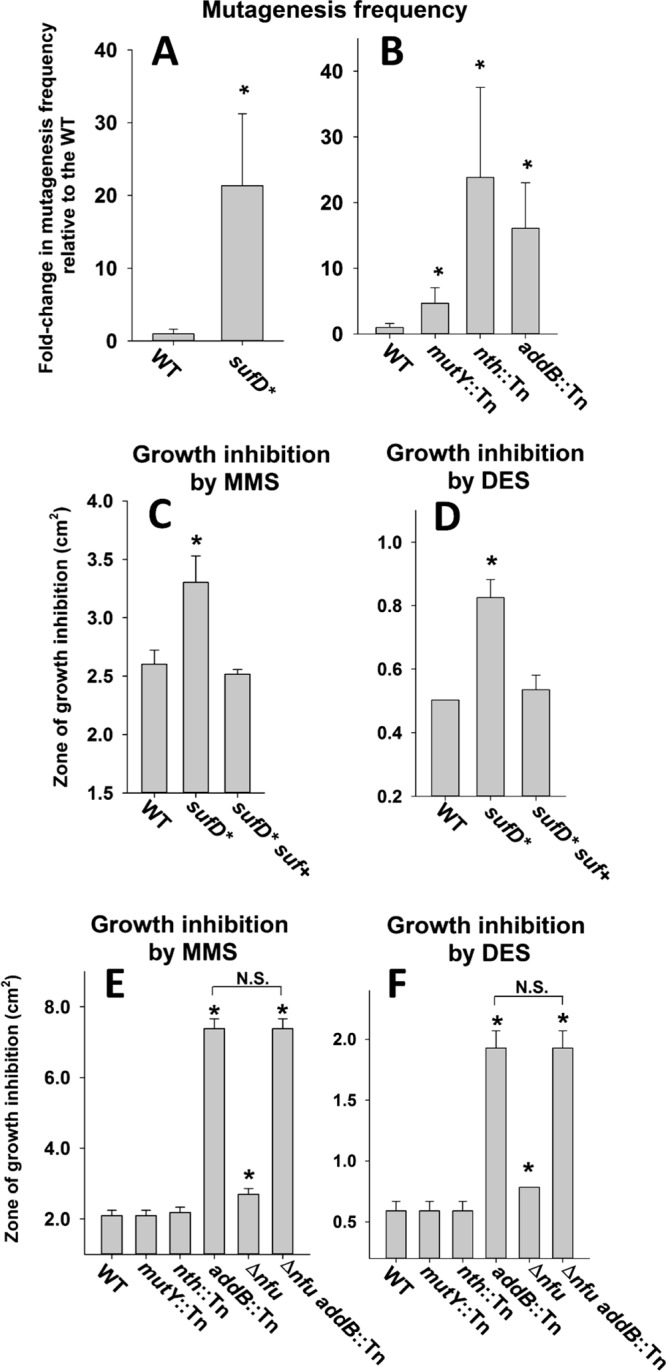
FIG 7.

Effect of decreased Suf function on DNA metabolism. (A) The frequency of spontaneous rifampin resistance was measured in the WT and sufD* strains. (B) The frequency of spontaneous rifampin resistance was measured in the WT, mutY::Tn, nth::Tn, and addB::Tn strains. (C) Sensitivity to MMS was assessed in the WT, sufD*, and sufD* suf+ strains. (D) Sensitivity to DES was assessed in the WT, sufD*, and sufD* suf+ strains. (E) Sensitivity to MMS was assessed in the WT, mutY::Tn, nth::Tn, addB::Tn, Δnfu, and Δnfu addB::Tn strains. (F) Sensitivity to DES was assessed in the WT, mutY::Tn, nth::Tn, addB::Tn, Δnfu, and Δnfu addB::Tn strains. The data presented in panels A and B represent the averages of 10 biological replicates with standard deviations. The data presented in panels C, D, E, and F represent the averages of biological triplicates with standard deviations. Student t tests (two tailed) were performed on the data; *, P < 0.05 relative to the WT strain unless otherwise indicated; N.S., not significant (P > 0.05).
