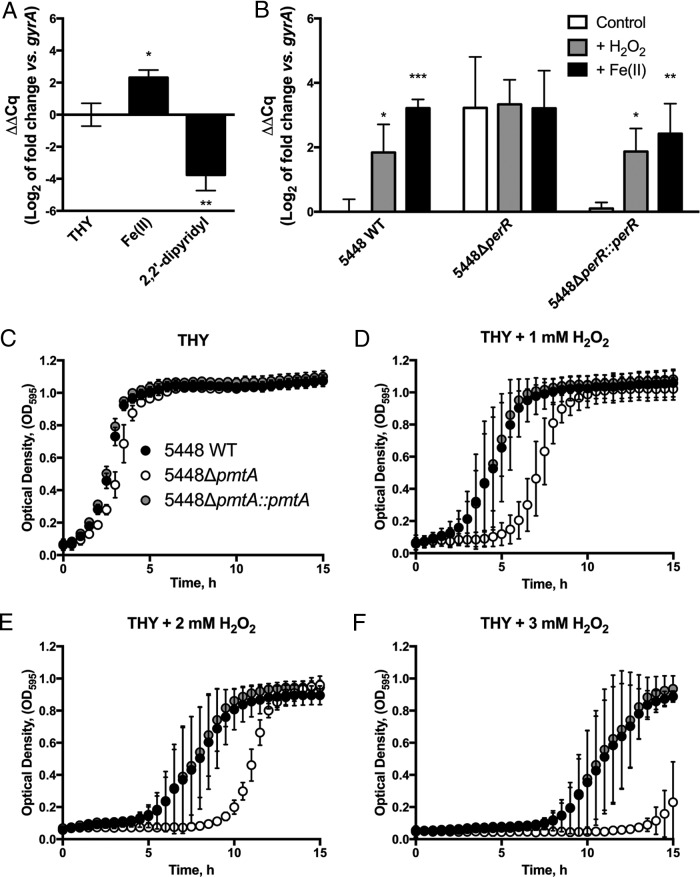
FIG 4.
Gene expression analysis of pmtA and H2O2 stress sensitivity. (A) 5448 WT was grown in the presence of Fe(II) or 2,2′-dipyridyl, and gene expression of pmtA was analyzed. (B) 5448 WT, 5448ΔperR, and 5448ΔperR::perR cells grown at 37°C to mid-exponential phase (OD600 = 0.6 to 0.8) were challenged with water (control), 5 mM H2O2, or 8 mM Fe(II) for 30 min. pmtA gene expression was analyzed by qPCR using gyrA as the reference gene. Data represent the mean ΔΔCq (log2) values ± standard deviations from 3 independent biological replicates (2-way ANOVA was used for all comparisons to the control for each strain [*, P < 0.05; ** P < 0.01; ***, P < 0.001]). (C to F) Growth curve analysis of 5448 WT, 5448ΔpmtA, and 5448ΔpmtA::pmtA in hydrogen peroxide. Strains were grown in THY broth plus 2 mM Fe(II) to mid-exponential phase (OD = 0.6 to 0.8) and diluted to an OD600 of 0.05 in THY broth with 0.00 mM (C), 1 mM (D), 2 mM (E), or 3 mM (F) H2O2. Growth at 37°C was monitored by recording the OD595. Graphs represent means ± standard deviations of data from 3 independent biological replicates.

