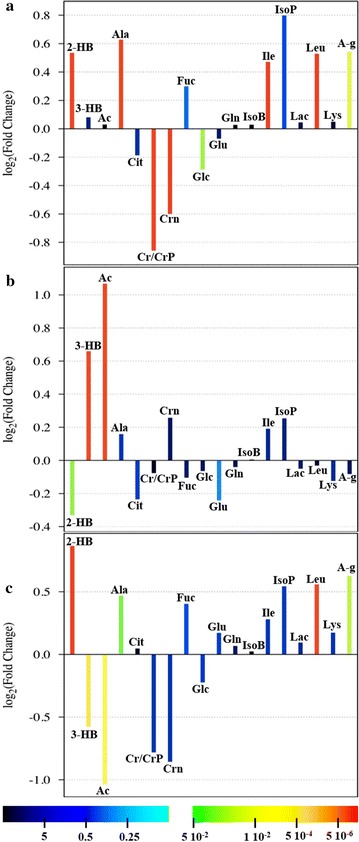
Fig. 5.

Fold-change plots color-coded based on corresponding P values (Corrected with Bonferroni Method) Pairwise comparisons between groups: a Micro vs Control, b SD vs Control, and c Micro vs SD. Metabolite abbreviations 2-hydroxybutyrate (2-HB), 3-hydroxybutyrate (3-HB), acetate (Ac), alanine (Ala), citrate (Cit), creatine/phosphocreatine (Cr/CrP), creatinine (Crn), fucose (Fuc), glucose (Glc), glutamate (Glu), glutamine (Gln), isobutyrate (IsoB), isoleucine (Ile), isopropanol (IsoP), lactate (Lac), leucine (Leu), lysine (Lys), N-acetyl group (A-g)
